Data Analysis with Python – How I Analyzed My Empire State Building Run-Up Performance

A tower running race is run on a building and these happen around the world. The one I got a chance to participate in was the Empire State Run Up in NYC, 2013 edition:
The Empire State Building Run-Up (ESBRU)—the world’s first and most famous tower race—challenges runners from near and far to race up its famed 86 flights—1,576 stairs. While visitors can reach the building’s Observatory via elevator in under one minute, the fastest runners have covered the 86 floors by foot in about 10 minutes. Leaders in the sport of professional tower-running converge at the Empire State Building in what some consider the ultimate test of endurance.
I got lucky and managed to participate in this race. A few days after finishing the race I realized that I wanted to know more about my performance, and what I could have done to better.
So naturally I went to the organizer website and started looking at the numbers. And it was slow and tedious, plus brought up more issues:
1) Getting the data for offline analysis is difficult. You can see your results and others for comparison, but I found that the tools neither offer an option to download the raw data, nor they were clumsy to use. 2) Most tools out there to analyze race results are paid or do not apply to this type of race. Knowing what to expect reduces your anxiety, allows you to train better, and keeps your expectations in check
By now you probably guessed that you can solve the data retrieval issues and post-race analysis using low-cost Open Source tools. This also allows you to apply different techniques to learn about the race and depending on the quality of the data even make performance predictions.
This is a very personal piece for me, I will share my race results and give you my biased opinion about the race:-D.
How I ended up running to the top of the Empire State Building
Most of us have run a regular race (there are many distances like 5K, 10K, Half Marathon, and Full Marathon) but there is no comparison on how you will perform while running the stairs all the way to the top of one of the most famous buildings in the world.
If you have ever been at the base of the skyscrapers in New York City and look up you get the idea. Picture yourself running through the stairs, all the way to the top, without stopping.
Getting accepted is tough, because unlike a race like the New York Marathon, the Empire State Building can only accommodate around 500 runners (or should I say climbers?). Add to that fact that the demand to participate is high, and then you can see that your chances to get in through the lottery are pretty slim (I read somewhere that lottery positions are only 50 for more than 5,000 applicants).
You can imagine my surprise when I got an email saying that I was selected to participate after trying for 4 years in a row.
I panicked. Have you ever been at the base of the Empire State and looked up? Some days when is cloudy you cannot even see the top of the building. I wasn’t unprepared. But I had to adjust my training routine to be ready for this challenge with a small window of two months, and no experience about doing a tower run.
The day of the race came and this is how it went for me:
- It was tough. I knew I had to pace myself, otherwise, the race would have ended for me on floor 20th as opposed to floor 86th. You have to zoom in into a “keep going”, regardless of how tired you feel. And then it is over, just like that.
- You don’t sprint, you climb 2 steps at a time at a steady pace, and you use the handrails to take off weight from your legs.
- No need to carb load or hydrate too much. If you do well, you will be done under around 30 minutes.
- Nobody is pushing anyone. At least for non-elite racers like me, I was alone for most of the race.
- I got passed and I passed a lot of people who forgot the ‘pace yourself’ rule. If you sprint, you will be toasted before floor 25, for sure.
I had a blast and got great satisfaction from having this race scratched from my bucket list, the same way as the NYC Marathon.
It was time now to do a post-race analysis using several of my favorite Open Source tools, which I’ll explain in the next section.
What do you need to follow this tutorial and what you will learn
Like the race, most of the challenges to writing the application were mental. You only need to break the main problem into smaller pieces and then tackle each one at a time:
1) Get the data, scraping the website (very few sites allow you to export race results as CSV) 2) Clean up the data, normalize it, and make it ready for automatic processing 3) Ask questions. Then translate those questions into code and tests, ideally using statistics to get reliable answers. 4) Present the results. A UI (Text or Graphic) will do wonders due to their low consumption, but charts speak volumes too.
You should have some experience in a programming language, my code is written in Python (you will need version 3.8+) and runs on Linux (I used Fedora 37 distribution).
In a Nutshell, I want to show that it is possible to do all the above with Open Source technologies, and then this knowledge is also reusable for other projects, not just tower races.
I strongly recommend you get the source code (It is Open Source!). Get your hands dirty, break the scripts, and have fun. You will need git to clone the repository:
git clone https://github.com/josevnz/tutorials.git
cd tutorials/docs/EmpireStateRunUp/
python -m ~/virtualenv/EmpireStateRunUp
. ~/virtualenv/EmpireStateRunUp/bin/activate
pip install --upgrade pip
pip install --upgrade build
pip install --upgrade wheel
pip install --editable .
Or if you just want to run the code while reading this tutorial (using my latest version from Pypi):
python -m ~/virtualenv/EmpireStateRunUp
. ~/virtualenv/EmpireStateRunUp/bin/activate
pip install --upgrade EmpireStateRunUp
We can now move to the next stage, getting the data.
Getting the data using web scraping
The race results site doesn’t have an export feature and I never heard back from their support team to see if there was an alternate way to get the race data, so the only alternative left was to do some web scraping.
The website is pretty basic and only allows scrolling through each record, so I decided to do web scraping to get the results into a format I could use later for data analysis.
The rules of web scraping
There are very 3 simple rules:
1) Rule #1: Please don’t do it. Data flow changes, your scraper will break the minute you are done getting the data. It will require time and effort. Lots of it. 2) Rule #2: Read rule number 1. If you cannot get the data in another format then go to rule #3 3) Rule #3: Choose a good framework to automate what you can and prepare to do heavy data cleanup (also known as give me patience for the stuff I cannot control, like poorly done HTML and CSS)
I decided to use Selenium Web Driver as it calls a real browser, like Firefox, to navigate the website. Selenium allows you to automate browser actions while you get the same rendered HTML you see when you navigate the site.
Selenium is a complex tool and will require you to spend some time experimenting with what works and what does not. Below is a simple script that can get all the
runner’s names and race detail links in one run:
import re
from time import sleep

from selenium import webdriver
from selenium.webdriver.common.by import By
from selenium.webdriver.firefox.options import Options
from selenium.webdriver.firefox.webdriver import WebDriver
from selenium.webdriver.support.wait import WebDriverWait
from selenium.webdriver.support import expected_conditions
# AthLinks are nice enough to post the race results and their interface is very human-friendly. Not so machine parsing friendly.
RESULTS = "https://www.athlinks.com/event/382111/results/Event/1062909/Course/2407855/Results"
LINKS = {}


def print_links(web_driver: WebDriver, page: int) -> None:
    for a in web_driver.find_elements(By.TAG_NAME, "a"):
        href = a.get_attribute('href')
        if re.search('Bib', href):
            name = a.text.strip().title()
            print(f"Page={page}, {name}={href.strip()}")
            LINKS[name] = href.strip()


def click(level: int) -> None:
    button = WebDriverWait(driver, 20).until(
        expected_conditions.element_to_be_clickable((By.CSS_SELECTOR, f"div:nth-child({level}) > button")))
    driver.execute_script("arguments[0].click();", button)
    sleep(2.5)


options = Options()
options.add_argument("--headless")
driver = webdriver.Firefox(options=options)
driver.get(RESULTS)
sleep(2.5)
print_links(driver, 1)
click(6)
print_links(driver, 2)
click(7)
print_links(driver, 3)
click(7)
print_links(driver, 4)
click(9)
print_links(driver, 5)
click(9)
print_links(driver, 6)
click(7)
print_links(driver, 7)
click(7)
print_links(driver, 8)
print(len(LINKS))
The code above is hardly reusable, but it gets the job done by doing the following:
1) Gets the main webpage with the driver.get(...) method,
2) Then get the <a href tags, sleep a little to get a chance to render the HTML,
3) Then find and click the > (next page) button.
4) Do this steps for a total of 8 times, as this is how many pages of results are available (each page has 50 runners)
To get the full race results I wrote scraper.py code, the code deals with navigating multiple pages and extracting the data. Demonstration below:
(EmpireStateRunUp) [josevnz@dmaf5 EmpireStateRunUp]$ esru_scraper /home/josevnz/temp/raw_data.csv
2023-12-30 14:05:00,987 Saving results to /home/josevnz/temp/raw_data.csv
2023-12-30 14:05:53,091 Got 377 racer results
2023-12-30 14:05:53,091 Processing BIB: 19, will fetch: https://www.athlinks.com/event/382111/results/Event/1062909/Course/2407855/Bib/19
2023-12-30 14:06:02,207 Wrote: name=Wai Ching Soh, position=1, {'name': 'Wai Ching Soh', 'url': 'https://www.athlinks.com/event/382111/results/Event/1062909/Course/2407855/Bib/19', 'overall position': '1', 'gender': 'M', 'age': 29, 'city': 'Kuala Lumpur', 'state': '-', 'country': 'MYS', 'bib': 19, '20th floor position': '1', '20th floor gender position': '1', '20th floor division position': '1', '20th floor pace': '42:30', '20th floor time': '1:42', '65th floor position': '1', '65th floor gender position': '1', '65th floor division position': '1', '65th floor pace': '54:03', '65th floor time': '7:34', 'gender position': '1', 'division position': '1', 'pace': '53:00', 'time': '10:36', 'level': 'Full Course'}
...
It does just minimal manipulation of the data from the web page, the purpose of this code is just to get the data as quickly as possible before the formatting changes
Data cannot be used yet as-is, needs cleaning up and that is the next step in this article.
Cleaning up the data
Getting the data is just the first battle of many more to come. You will notice inconsistencies on the data, missing values and in order to make your numeric results good, you need to make assumptions.
Luckily for me, the dataset is very small (375+ records, one for each runner) so I was able to come up with a few rules to tidy up the data file I was going to use during my analysis.
I also supplemented my data with another data set that has the countries 3-digit codes as well as other details, for a nicer presentation.
The data_normalizer.raw_read(raw_file: Path) -> Iterable[Dict[str, Any]] method does the heavy work of fixing the data for inconsistencies before saving into a CSV format.
There are no hard rules here as cleanup has a high correlation with the data set. For example, to figure out to which wave each runner was assigned I had to make some assumptions based on what I saw the day of the race.
Let me show you what I mean with some code:
import datetime
from enum import Enum
from typing import Dict

"""
Runners started on waves, but for basic analysis, we will assume all runners were able to run
at the same time.
"""
BASE_RACE_DATETIME = datetime.datetime(
    year=2023,
    month=9,
    day=4,
    hour=20,
    minute=0,
    second=0,
    microsecond=0
)

class Waves(Enum):
    """
    22 Elite male
    17 Elite female
    There are some holes, so either some runners did not show up or there was spare capacity.
    https://runsignup.com/Race/EmpireStateBuildingRunUp/Page-4
    https://runsignup.com/Race/EmpireStateBuildingRunUp/Page-5
    I guessed who went into which category, based on the BIB numbers I saw that day
    """
    ELITE_MEN = ["Elite Men", [1, 25], BASE_RACE_DATETIME]
    ELITE_WOMEN = ["Elite Women", [26, 49], BASE_RACE_DATETIME + datetime.timedelta(minutes=2)]
    PURPLE = ["Specialty", [100, 199], BASE_RACE_DATETIME + datetime.timedelta(minutes=10)]
    GREEN = ["Sponsors", [200, 299], BASE_RACE_DATETIME + datetime.timedelta(minutes=20)]
    """
    The date people applied for the lottery determined the colors. Let's assume that
    General Lottery Open: 7/17 9AM- 7/28 11:59PM
    General Lottery Draw Date: 8/1
    """
    ORANGE = ["Tenants", [300, 399], BASE_RACE_DATETIME + datetime.timedelta(minutes=30)]
    GREY = ["General 1", [400, 499], BASE_RACE_DATETIME + datetime.timedelta(minutes=40)]
    GOLD = ["General 2", [500, 599], BASE_RACE_DATETIME + datetime.timedelta(minutes=50)]
    BLACK = ["General 3", [600, 699], BASE_RACE_DATETIME + datetime.timedelta(minutes=60)]

"""
Interested only in people who completed the 86 floors. So is it either a full course or dnf
"""
class Level(Enum):
    FULL = "Full Course"
    DNF = "DNF"

# Fields are sorted by interest
class RaceFields(Enum):
    BIB = "bib"
    NAME = "name"
    OVERALL_POSITION = "overall position"
    TIME = "time"
    GENDER = "gender"
    GENDER_POSITION = "gender position"
    AGE = "age"
    DIVISION_POSITION = "division position"
    COUNTRY = "country"
    STATE = "state"
    CITY = "city"
    PACE = "pace"
    TWENTY_FLOOR_POSITION = "20th floor position"
    TWENTY_FLOOR_GENDER_POSITION = "20th floor gender position"
    TWENTY_FLOOR_DIVISION_POSITION = "20th floor division position"
    TWENTY_FLOOR_PACE = '20th floor pace'
    TWENTY_FLOOR_TIME = '20th floor time'
    SIXTY_FLOOR_POSITION = "65th floor position"
    SIXTY_FIVE_FLOOR_GENDER_POSITION = "65th floor gender position"
    SIXTY_FIVE_FLOOR_DIVISION_POSITION = "65th floor division position"
    SIXTY_FIVE_FLOOR_PACE = '65th floor pace'
    SIXTY_FIVE_FLOOR_TIME = '65th floor time'
    WAVE = "wave"
    LEVEL = "level"
    URL = "url"

FIELD_NAMES = [x.value for x in RaceFields if x != RaceFields.URL]
FIELD_NAMES_FOR_scraping = [x.value for x in RaceFields]
FIELD_NAMES_AND_POS: Dict[RaceFields, int] = {}
pos = 0
for field in RaceFields:
    FIELD_NAMES_AND_POS[field] = pos
    pos += 1

def get_wave_from_bib(bib: int) -> Waves:
    for wave in Waves:
        (lower, upper) = wave.value[1]
        if lower <= bib <= upper:
            return wave
    return Waves.BLACK

def get_description_for_wave(wave: Waves) -> str:
    return wave.value[0]
I used enums to make it clear what type of data I was working on, especially for the names of the fields. Consistency is key.
As for cleaning the data, well there were some obvious fixes I had to apply like: 1) Format of the times like pace, race time, etc. so it could be parsed later 2) Capitalize some values to make them easier to read 3) Early string to integer conversion for values like age, position, etc. If that fails assign ‘not a number’
By all means, we are not done massaging the data. A simple function takes care of this stage inside the data module:
# Omitted imports and Enum declarations as they were shown early on.
# Check the source code for 'data.py' for more details
def raw_csv_read(raw_file: Path) -> Iterable[Dict[str, Any]]:
    record = {}
    with open(raw_file, 'r') as raw_csv_file:
        reader = csv.DictReader(raw_csv_file)
        row: Dict[str, Any]
        for row in reader:
            try:
                csv_field: str
                for csv_field in FIELD_NAMES_FOR_scraping:
                    column_val = row[csv_field].strip()
                    if csv_field == RaceFields.BIB.value:
                        bib = int(column_val)
                        record[csv_field] = bib
                    elif csv_field in [ RaceFields.GENDER_POSITION.value, RaceFields.DIVISION_POSITION.value, RaceFields.OVERALL_POSITION.value,  RaceFields.TWENTY_FLOOR_POSITION.value,
                        RaceFields.TWENTY_FLOOR_DIVISION_POSITION.value, RaceFields.TWENTY_FLOOR_GENDER_POSITION.value, RaceFields.SIXTY_FLOOR_POSITION.value, RaceFields.SIXTY_FIVE_FLOOR_DIVISION_POSITION.value,
                        RaceFields.SIXTY_FIVE_FLOOR_GENDER_POSITION.value, RaceFields.AGE.value ]:
                        try:
                            record[csv_field] = int(column_val)
                        except ValueError:
                            record[csv_field] = math.nan
                    elif csv_field == RaceFields.WAVE.value:
                        record[csv_field] = get_description_for_wave(get_wave_from_bib(bib)).upper()
                    elif csv_field in [RaceFields.GENDER.value, RaceFields.COUNTRY.value]:
                        record[csv_field] = column_val.upper()
                    elif csv_field in [RaceFields.CITY.value, RaceFields.STATE.value,

                    ]:
                        record[csv_field] = column_val.capitalize()
                    elif csv_field in [RaceFields.SIXTY_FIVE_FLOOR_PACE.value, RaceFields.SIXTY_FIVE_FLOOR_TIME.value, RaceFields.TWENTY_FLOOR_PACE.value,
                        RaceFields.TWENTY_FLOOR_TIME.value, RaceFields.PACE.value, RaceFields.TIME.value ]:
                        parts = column_val.strip().split(':')
                        for idx in range(0, len(parts)):
                            if len(parts[idx]) == 1:
                                parts[idx] = f"0{parts[idx]}"
                        if len(parts) == 2:
                            parts.insert(0, "00")
                        record[csv_field] = ":".join(parts)
                    else:
                        record[csv_field] = column_val
                if record[csv_field] in ['-', '--']:
                    record[csv_field] = ""
                yield record
            except IndexError:
                raise
The esru_csv_cleaner script is the sum of the first stage cleanup effort, which takes the raw captured data and writes a CSV file with some important corrections:
esru_csv_cleaner --rawfile /home/josevnz/temp/raw_data.csv /home/josevnz/tutorials/docs/EmpireStateRunUp/empirestaterunup/results-full-level-2023.csv
Now with the data ready we can proceed to load the data and ask some questions about the race.
Analyzing the data
Once the data is clean (or as clean as we can), it is time to move into running some numbers. Before writing more code, I took a piece of paper and asked myself a few questions about the race:
- There are any interesting buckets/ clusters for age, race time, wave, and country participation?
- A histogram for Age and Country would be nice to see
- Describe the data! (median, percentiles, etc.)
- Find outliers. There is a way to apply Z-scores here?
I decided to use Python Pandas for this task. This Open Source framework has an arsenal of tools to manipulate the data and to calculate statistics. It also has good tools to perform additional cleanup if needed.
So how do Pandas work?
Crash course on Pandas
I strongly recommend that you take the 10 minutes to pandas if you are not familiar with Pandas. For my DataFrame, I made the BIB an index as it is unique, and it has no special value for aggregation functions but the ‘id’ attribute is unique. It is important to say that also at this stage I needed to normalize the data, which I’ll explain shortly:
# Omitted imports and Enum declarations as they were shown early on.
# Check the source code for 'data.py' for more details
def load_data(data_file: Path = None, remove_dnf: bool = True) -> DataFrame:
    """
    * The code removes by default the DNF runners to avoid distortion on the results.
    * Replace unknown/ nan values with the median, to make analysis easier and avoid distortions
    """
    if data_file:
        def_file = data_file
    else:
        def_file = RACE_RESULTS_FULL_LEVEL
    df = pandas.read_csv(
        def_file
    )
    for time_field in [
        RaceFields.PACE.value,
        RaceFields.TIME.value,
        RaceFields.TWENTY_FLOOR_PACE.value,
        RaceFields.TWENTY_FLOOR_TIME.value,
        RaceFields.SIXTY_FIVE_FLOOR_PACE.value,
        RaceFields.SIXTY_FIVE_FLOOR_TIME.value
    ]:
        try:
            df[time_field] = pandas.to_timedelta(df[time_field])
        except ValueError as ve:
            raise ValueError(f'{time_field}={df[time_field]}', ve)
    df['finishtimestamp'] = BASE_RACE_DATETIME + df[RaceFields.TIME.value]
    if remove_dnf:
        df.drop(df[df.level == 'DNF'].index, inplace=True)

    # Normalize Age
    median_age = df[RaceFields.AGE.value].median()
    df[RaceFields.AGE.value].fillna(median_age, inplace=True)
    df[RaceFields.AGE.value] = df[RaceFields.AGE.value].astype(int)

    # Normalize state and city
    df.replace({RaceFields.STATE.value: {'-': ''}}, inplace=True)
    df[RaceFields.STATE.value].fillna('', inplace=True)
    df[RaceFields.CITY.value].fillna('', inplace=True)

    # Normalize overall position, 3 levels
    median_pos = df[RaceFields.OVERALL_POSITION.value].median()
    df[RaceFields.OVERALL_POSITION.value].fillna(median_pos, inplace=True)
    df[RaceFields.OVERALL_POSITION.value] = df[RaceFields.OVERALL_POSITION.value].astype(int)
    median_pos = df[RaceFields.TWENTY_FLOOR_POSITION.value].median()
    df[RaceFields.TWENTY_FLOOR_POSITION.value].fillna(median_pos, inplace=True)
    df[RaceFields.TWENTY_FLOOR_POSITION.value] = df[RaceFields.TWENTY_FLOOR_POSITION.value].astype(int)
    median_pos = df[RaceFields.SIXTY_FLOOR_POSITION.value].median()
    df[RaceFields.SIXTY_FLOOR_POSITION.value].fillna(median_pos, inplace=True)
    df[RaceFields.SIXTY_FLOOR_POSITION.value] = df[RaceFields.SIXTY_FLOOR_POSITION.value].astype(int)

    # Normalize gender position, 3 levels
    median_gender_pos = df[RaceFields.GENDER_POSITION.value].median()
    df[RaceFields.GENDER_POSITION.value].fillna(median_gender_pos, inplace=True)
    df[RaceFields.GENDER_POSITION.value] = df[RaceFields.GENDER_POSITION.value].astype(int)
    median_gender_pos = df[RaceFields.TWENTY_FLOOR_GENDER_POSITION.value].median()
    df[RaceFields.TWENTY_FLOOR_GENDER_POSITION.value].fillna(median_gender_pos, inplace=True)
    df[RaceFields.TWENTY_FLOOR_GENDER_POSITION.value] = df[RaceFields.TWENTY_FLOOR_GENDER_POSITION.value].astype(int)
    median_gender_pos = df[RaceFields.SIXTY_FIVE_FLOOR_GENDER_POSITION.value].median()
    df[RaceFields.SIXTY_FIVE_FLOOR_GENDER_POSITION.value].fillna(median_gender_pos, inplace=True)
    df[RaceFields.SIXTY_FIVE_FLOOR_GENDER_POSITION.value] = df[
        RaceFields.SIXTY_FIVE_FLOOR_GENDER_POSITION.value].astype(int)

    # Normalize age/ division position, 3 levels
    median_div_pos = df[RaceFields.DIVISION_POSITION.value].median()
    df[RaceFields.DIVISION_POSITION.value].fillna(median_div_pos, inplace=True)
    df[RaceFields.DIVISION_POSITION.value] = df[RaceFields.DIVISION_POSITION.value].astype(int)
    median_div_pos = df[RaceFields.TWENTY_FLOOR_DIVISION_POSITION.value].median()
    df[RaceFields.TWENTY_FLOOR_DIVISION_POSITION.value].fillna(median_div_pos, inplace=True)
    df[RaceFields.TWENTY_FLOOR_DIVISION_POSITION.value] = df[RaceFields.TWENTY_FLOOR_DIVISION_POSITION.value].astype(int)
    median_div_pos = df[RaceFields.SIXTY_FIVE_FLOOR_DIVISION_POSITION.value].median()
    df[RaceFields.SIXTY_FIVE_FLOOR_DIVISION_POSITION.value].fillna(median_div_pos, inplace=True)
    df[RaceFields.SIXTY_FIVE_FLOOR_DIVISION_POSITION.value] = df[
        RaceFields.SIXTY_FIVE_FLOOR_DIVISION_POSITION.value].astype(int)

    # Normalize 65th floor pace and time
    sixty_five_floor_pace_median = df[RaceFields.SIXTY_FIVE_FLOOR_PACE.value].median()
    sixty_five_floor_time_median = df[RaceFields.SIXTY_FIVE_FLOOR_TIME.value].median()
    df[RaceFields.SIXTY_FIVE_FLOOR_PACE.value].fillna(sixty_five_floor_pace_median, inplace=True)
    df[RaceFields.SIXTY_FIVE_FLOOR_TIME.value].fillna(sixty_five_floor_time_median, inplace=True)

    # Normalize BIB and make it the index
    df[RaceFields.BIB.value] = df[RaceFields.BIB.value].astype(int)
    df.set_index(RaceFields.BIB.value, inplace=True)

    # URL was useful during scraping, not needed for analysis
    df.drop([RaceFields.URL.value], axis=1, inplace=True)

    return df
I do a few things here after giving back the converted CSV back to the user, as a DataFrame:
- Replacing “Not a Number” (nan) values with the median, to avoid affecting the aggregation results. Makes analysis easier.
- Drop rows for runners that did not reach floor 86. Makes the analysis easier, and it is too few of them.
- Convert some string columns into native data types like integers, timestamps
- A few entries did not have the gender defined. That affected other fields like ‘gender_position’. To avoid distortions, these were filled with the median.
In the end, this is how my DataFrame loading looked like:
(EmpireStateRunUp) [josevnz@dmaf5 EmpireStateRunUp]$ python3
Python 3.11.6 (main, Oct  3 2023, 00:00:00) [GCC 12.3.1 20230508 (Red Hat 12.3.1-1)] on linux
Type "help", "copyright", "credits" or "license" for more information.
And the resulting DataFrame instance:
>>> # Using custom load_data function that returns a Panda DataFrame
>>> from empirestaterunup.data import load_data
>>> load_data('empirestaterunup/results-full-level-2023.csv')
                    name  overall position            time gender  gender position  age  ...  65th floor division position 65th floor pace 65th floor time       wave        level     finishtimestamp
bib                                                                                      ...
19         Wai Ching Soh                 1 0 days 00:10:36      M                1   29  ...                             1 0 days 00:54:03 0 days 00:07:34  ELITE MEN  Full Course 2023-09-04 20:10:36
22        Ryoji Watanabe                 2 0 days 00:10:52      M                2   40  ...                             1 0 days 00:54:31 0 days 00:07:38  ELITE MEN  Full Course 2023-09-04 20:10:52
16            Fabio Ruga                 3 0 days 00:11:14      M                3   42  ...                             2 0 days 00:57:09 0 days 00:08:00  ELITE MEN  Full Course 2023-09-04 20:11:14
11        Emanuele Manzi                 4 0 days 00:11:28      M                4   45  ...                             3 0 days 00:59:17 0 days 00:08:18  ELITE MEN  Full Course 2023-09-04 20:11:28
249             Alex Cyr                 5 0 days 00:11:52      M                5   28  ...                             2 0 days 01:01:19 0 days 00:08:35   SPONSORS  Full Course 2023-09-04 20:11:52
..                   ...               ...             ...    ...              ...  ...  ...                           ...             ...             ...        ...          ...                 ...
555     Caroline Edwards               372 0 days 00:55:17      F              143   47  ...                            39 0 days 04:57:23 0 days 00:41:38  GENERAL 2  Full Course 2023-09-04 20:55:17
557        Sarah Preston               373 0 days 00:55:22      F              144   34  ...                            41 0 days 04:58:20 0 days 00:41:46  GENERAL 2  Full Course 2023-09-04 20:55:22
544  Christopher Winkler               374 0 days 01:00:10      M              228   40  ...                            18 0 days 01:49:53 0 days 00:15:23  GENERAL 2  Full Course 2023-09-04 21:00:10
545          Jay Winkler               375 0 days 01:05:19      U               93   33  ...                            18 0 days 05:28:56 0 days 00:46:03  GENERAL 2  Full Course 2023-09-04 21:05:19
646           Dana Zajko               376 0 days 01:06:48      F              145   38  ...                            42 0 days 05:15:14 0 days 00:44:08  GENERAL 3  Full Course 2023-09-04 21:06:48

[375 rows x 24 columns]
Once the data was loaded, I was able to start asking questions. For example, to detect the outliers I used a Z-score.
All the analysis logic was kept together on a single module called ‘analyze’, separate from presentation, data loading, or reports, to promote reuse.
from pandas import DataFrame
import numpy as np
def get_zscore(df: DataFrame, column: str):
    filtered = df[column]
    return filtered.sub(filtered.mean()).div(filtered.std(ddof=0))

def get_outliers(df: DataFrame, column: str, std_threshold: int = 3) -> DataFrame:
    """
    Use the z-score, anything further away than 3 standard deviations is considered an outlier.
    """
    filtered_df = df[column]
    z_scores = get_zscore(df=df, column=column)
    is_over = np.abs(z_scores) > std_threshold
    return filtered_df[is_over]
Also, it is very simple to get common statistics just by calling describe on our data:
from pandas import DataFrame
def get_5_number(criteria: str, data: DataFrame) -> DataFrame:
    return data[criteria].describe()
For example, let me show you summary metrics for different aspects of the race:
>>> from empirestaterunup.data import load_data
>>> df = load_data('empirestaterunup/results-full-level-2023.csv')
>>> from empirestaterunup.analyze import get_5_number
>>> from empirestaterunup.analyze import SUMMARY_METRICS
>>> print(SUMMARY_METRICS)
('age', 'time', 'pace')
>>> for key in SUMMARY_METRICS:
...     ndf = get_5_number(criteria=key, data=df)
...     print(ndf)
...
count    375.000000
mean      41.309333
std       11.735968
min       11.000000
25%       33.000000
50%       40.000000
75%       49.000000
max       78.000000
Name: age, dtype: float64
count                          375
mean     0 days 00:23:03.461333333
std      0 days 00:08:06.313479117
min                0 days 00:10:36
25%                0 days 00:18:09
50%                0 days 00:21:20
75%         0 days 00:25:13.500000
max                0 days 01:06:48
Name: time, dtype: object
count                          375
mean     0 days 01:55:17.306666666
std      0 days 00:40:31.567395588
min                0 days 00:53:00
25%                0 days 01:30:45
50%                0 days 01:46:40
75%         0 days 02:06:07.500000
max                0 days 05:34:00
Name: pace, dtype: object
Making sure data web scraping, data loading, and analytics work well is a must. Testing is part integral of writing code, so I kept adding more of it and went back to writing unit tests.
Let’s check how to test our code (feel free to skip the next section if you are familiar with unit testing)
Testing, testing, and after that … testing
I assume you are familiar with writing small, self-contained pieces of code to test your code. These are called unit tests.
The unittest unit testing framework was originally inspired by JUnit and has a similar flavor as major unit testing frameworks in other languages. It supports test automation, sharing of setup and shutdown code for tests, aggregation of tests into collections, and independence of the tests from the reporting framework.
I tried to have a simple unit test for every method I wrote on the code. This saved me lots of headaches down the road, as I refactored the code I found better ways to get the same results, producing correct numbers.
A Unit test in this context is a class that extends ‘unittest.TestCase’. Each method that starts with ‘test_’ is a test that must pass several assertions.
For example, to make sure the analytics work as expected I wrote a test module called ‘test_analyze’:
# Not all test cases are shown, please check the full code of 'test/test_analyze.py'
import unittest
from pandas import DataFrame
from empirestaterunup.analyze import get_country_counts
from empirestaterunup.data import load_data

class AnalyzeTestCase(unittest.TestCase):
    df: DataFrame

    @classmethod
    def setUpClass(cls) -> None:
        cls.df = load_data()

    def test_get_country_counts(self):
        country_counts, min_countries, max_countries = get_country_counts(df=AnalyzeTestCase.df)
        self.assertIsNotNone(country_counts)
        self.assertEqual(2, country_counts['JPN'])
        self.assertIsNotNone(min_countries)
        self.assertEqual(3, min_countries.shape[0])
        self.assertIsNotNone(max_countries)
        self.assertEqual(14, max_countries.shape[0])


if __name__ == '__main__':
    unittest.main()
So far we got the data, and made sure it meets the expectations. I wrote separate tests for the analytics code and also for the scraper.
Testing the user interface requires a different approach, it needs to simulate clicks and wait for screen changes. Sometimes failures are easy to spot (like crashes), but sometimes issues are much more subtle (did we get the right data displayed).
Will revisit this particular testing modality after we introduce first how to visualize the results.
Visualizing the results
I wanted to use the terminal as much as possible to visualize my findings, and to keep requirements to the minimum. I decided to use the Textual framework to accomplish that. This framework is very complete and allows you to build text applications that are responsive and beautiful to look at.
They are also easy to write, so before we go deeper into the resulting applications let’s pause to learn about Textual.
Text User Interfaces (TUI) with Textual
The Textual project has a nice tutorial that you can read to get up to speed.
Let’s see some code, one of the applications is called ‘esru_outlier’, TUI code lives on the apps module that shows several tables together with the outliers we found before, using the z-score.
OutlierApp (extends App), collects all the basic information on a table for each outlier group and then calls the RunnerDetailScreen to display details about a runner.
Next is code with explanations
# Only the code of the application shown here
# This application shows 3 tables: SUMMARY_METRICS = (RaceFields.AGE.value, RaceFields.TIME.value, RaceFields.PACE.value)
# Every application in Textual extends the App class
class OutlierApp(App):
    DF: DataFrame = None
    BINDINGS = [ ("q", "quit_app", "Quit"), ]  # Bind 'q' to 'quit_app' method `action_quit_app`, which in turn exists the app
    CSS_PATH = "outliers.tcss"  # Styling can be done externally, similar to using CSS
    ENABLE_COMMAND_PALETTE = False

    def action_quit_app(self):
        self.exit(0)

    def compose(self) -> ComposeResult:
        """
        Here we 'Yield' Widgets/ components that will be rendered in order on the TUI
        How do the components get their layout on the screen? They use a cascade style sheet (CSS): outliers.tcss and
        some explicit layout containers like the class `Vertical` that can contain other Widgets
        Here we have a header, tables, and a footer
        """
        yield Header(show_clock=True)
        for column_name in SUMMARY_METRICS:
            table = DataTable(id=f'{column_name}_outlier')
            table.cursor_type = 'row'
            table.zebra_stripes = True
            table.tooltip = "Get runner details"
            if column_name == RaceFields.AGE.value:
                label = Label(f"{column_name} (older) outliers:".title())
            else:
                label = Label(f"{column_name} (slower) outliers:".title())
            yield Vertical(
                label,
                table
            )
        yield Footer()

    def on_mount(self) -> None:
        """
        Here we populate each table with data from the DataFrame. Each table has outliers of different types,
        all can be obtained with the `get_outliers` method.
        """
        for column in SUMMARY_METRICS:
            table = self.get_widget_by_id(f'{column}_outlier', expect_type=DataTable)
            columns = [x.title() for x in ['bib', column]]
            table.add_columns(*columns)
            table.add_rows(*[get_outliers(df=OutlierApp.DF, column=column).to_dict().items()])

    @on(DataTable.HeaderSelected)
    def on_header_clicked(self, event: DataTable.HeaderSelected):
        """
        When the user selects a column header it generates a 'HeaderSelected' event.
        The annotation on this method tells Textual that will handle this event here
        We can extract the table, the selected column, and then sort the table contents.
        """
        table = event.data_table
        table.sort(event.column_key)

    @on(DataTable.RowSelected)
    def on_row_clicked(self, event: DataTable.RowSelected) -> None:
        """
        Similarly, when the user selects a row it generates a RowSelected method
        What we do on the 'on_row_clicked' method is to capture the event, get the row contents, and construct
        a new modal screen (RunnerDetailScreen) which we push on top of the regular screen.
        There we show the runner details differently.
        """
        table = event.data_table
        row = table.get_row(event.row_key)
        runner_detail = RunnerDetailScreen(df=OutlierApp.DF, row=row)
        self.push_screen(runner_detail)
The class RunnerDetailScreen (extends ModalScreen), handles showing the racer details using formatted Markdown:
And the code with explanations:
# Omitted imports and helper methods, only showing TUI-related code. See the 'apps.py' file for full code
class RunnerDetailScreen(ModalScreen):
    ENABLE_COMMAND_PALETTE = False  # Disable the search bar, it is active by default and is not needed here
    CSS_PATH = "runner_details.tcss"  # Handle the styles using an external CSS

    def __init__(
            self,
            name: str | None = None,
            ident: str | None = None,
            classes: str | None = None,
            row: List[Any] | None = None,
            df: DataFrame = None,
            country_df: DataFrame = None
    ):
        """
        Override the constructor and load useful data like country ISO codes
        We get the Panda DataFrame with the details that will be shown to the user
        """
        super().__init__(name, ident, classes)
        self.row = row
        self.df = df
        if not country_df:
            self.country_df = load_country_details()
        else:
            self.country_df = country_df

    def compose(self) -> ComposeResult:
        """
        In compose we prepare the markdown, and we let the MarkdownViewer handle details like
        a nice automatic table of contents.
        Notice that we call `self.log.info('xxx'). We use that for debugging when this application
        is called using 'textual'.
        """
        bib_idx = FIELD_NAMES_AND_POS[RaceFields.BIB]
        bibs = [self.row[bib_idx]]
        columns, details = df_to_list_of_tuples(self.df, bibs)
        self.log.info(f"Columns: {columns}")
        self.log.info(f"Details: {details}")
        row_markdown = ""
        position_markdown = {}
        split_markdown = {}
        for legend in ['full', '20th', '65th']:
            position_markdown[legend] = ''
            split_markdown[legend] = ''
        for i in range(0, len(columns)):
            column = columns[i]
            detail = details[0][i]
            if re.search('pace|time', column):
                if re.search('20th', column):
                    split_markdown['20th'] += f"\n* **{column.title()}:** {detail}"
                elif re.search('65th', column):
                    split_markdown['65th'] += f"\n* **{column.title()}:** {detail}"
                else:
                    split_markdown['full'] += f"\n* **{column.title()}:** {detail}"
            elif re.search('position', column):
                if re.search('20th', column):
                    position_markdown['20th'] += f"\n* **{column.title()}:** {detail}"
                elif re.search('65th', column):
                    position_markdown['65th'] += f"\n* **{column.title()}:** {detail}"
                else:
                    position_markdown['full'] += f"\n* **{column.title()}:** {detail}"
            elif re.search('url|bib', column):
                pass  # Skip uninteresting columns
            else:
                row_markdown += f"\n* **{column.title()}:** {detail}"
        yield MarkdownViewer(f"""# Full Course Race details
## Runner BIO (BIB: {bibs[0]})
{row_markdown}
## Positions
### 20th floor
{position_markdown['20th']}
### 65th floor
{position_markdown['65th']}
### Full course
{position_markdown['full']}
## Race time split
### 20th floor
{split_markdown['20th']}
### 65th floor
{split_markdown['65th']}
### Full course
{split_markdown['full']}
        """)
        # This button is used to close this screen and send the user to the previous screen
        btn = Button("Close", variant="primary", id="close")
        btn.tooltip = "Back to main screen"
        yield btn

    @on(Button.Pressed, "#close")
    def on_button_pressed(self, _) -> None:
        """
        Simple logic, pop the previous screen and make this one disappear
        """
        self.app.pop_screen()
This class is reusable, there are other classes (like BrowserApp) part of this tutorial that also send data when a user clicks on a table row, and those details get displayed using this modal screen.
What about the CSS? It looks a lot like the web applications CSS (not the same). For example the :
Button {
    dock: bottom;
    width: 100%;
    height: auto;
}
As you can see, Textual is a pretty powerful framework that reminds me a lot of Java Swing, but without the extra complexity.
But is it just information in tabular format? I also wanted to have different graph types that could explain behavior like age cluster and gender distribution. For that, I wrote a few classes on the ‘apps’ module with the help of Matplotlib:
Plots with Matplotlib
I wanted to get some charts, these were made with matplotlib. The code to generate the plots is very straightforward.
And the code:
# Not all code is shown here (helper methods, imports)
# Please check the apps.py module to see all missing code
class Plotter:
    def plot_gender(self):
        """
        In this method, we get our data frame filtering by gender and get counts
        Then we create a pie plot
        """
        series = self.df[RaceFields.GENDER.value].value_counts()
        fig, ax = plt.subplots(layout='constrained')
        wedges, texts, auto_texts = ax.pie(
            series.values,
            labels=series.keys(),
            autopct="%%%.2f",
            shadow=True,
            startangle=90,
            explode=(0.1, 0, 0)
        )
        ax.set_title = "Gender participation"
        ax.set_xlabel('Gender distribution')

        # Legend with the fastest runners by gender
        fastest = find_fastest(self.df, FastestFilters.Gender)
        fastest_legend = [f"{fastest[gender]['name']} - {beautify_race_times(fastest[gender]['time'])}" for gender in
                          series.keys()]
        ax.legend(wedges, fastest_legend,
                  title="Fastest by gender",
                  loc="center left",
                  bbox_to_anchor=(1, 0, 0.5, 1))
Now let’s go back to testing TUI
Testing the user interfaces
When I started working on this small project I knew that there was going to be a lot of testing. What I wasn’t sure was how I would be able to test the TUI.
I figured at least two ways with Textual:
Following the message flow with textual
Textual supports an interesting development mode that allows you to change CSS and see the changes on your application without a restart. Also, you can see how the TUI events propagate, which is invaluable for debugging.
On one terminal you start the console:
(EmpireStateRunUp) [josevnz@dmaf5 EmpireStateRunUp]$ . ~/virtualenv/EmpireStateRunUp/bin/activate
(EmpireStateRunUp) [josevnz@dmaf5 EmpireStateRunUp]$ textual console
▌Textual Development Console v0.46.0
▌Run a Textual app with textual run --dev my_app.py to connect.
▌Press Ctrl+C to quit.
Then on another terminal, you start your application but using the development mode:
(EmpireStateRunUp) [josevnz@dmaf5 EmpireStateRunUp]$ textual run --dev --command esru_browser
if you check back on your console terminal, you will see any messages you sent with App.log and also the events:
─────────────────────────────────────────────────────────────────────────── Client '127.0.0.1' connected ───────────────────────────────────────────────────────────────────────────
[18:28:17] SYSTEM                                                                                                                                                        app.py:2188
Connected to devtools ( ws://127.0.0.1:8081 )
[18:28:17] SYSTEM                                                                                                                                                        app.py:2192
---
[18:28:17] SYSTEM                                                                                                                                                        app.py:2194
driver=<class 'textual.drivers.linux_driver.LinuxDriver'>
[18:28:17] SYSTEM                                                                                                                                                        app.py:2195
loop=<_UnixSelectorEventLoop running=True closed=False debug=False>
[18:28:17] SYSTEM                                                                                                                                                        app.py:2196
features=frozenset({'debug', 'devtools'})
[18:28:17] SYSTEM                                                                                                                                                        app.py:2228
STARTED FileMonitor({PosixPath('/home/josevnz/EmpireStateCleanup/docs/EmpireStateRunUp/empirestaterunup/browser.tcss')})
[18:28:17] EVENT                                                                                                                                                 message_pump.py:706
Load() >>> BrowserApp(title='Race Runners', classes={'-dark-mode'}) method=None
[18:28:17] EVENT                                                                                                                                                 message_pump.py:697
Mount() >>> DataTable(id='runners') method=<ScrollView.on_mount>
[18:28:17] EVENT                                                                                                                                                 message_pump.py:697
Mount() >>> DataTable(id='runners') method=<Widget.on_mount>
[18:28:17] EVENT                                                                                                                                                 message_pump.py:697
Mount() >>> Footer() method=<Footer.on_mount>
[18:28:17] EVENT                                                                                                                                                 message_pump.py:697
Mount() >>> Footer() method=<Widget.on_mount>
[18:28:17] EVENT                                                                                                                                                 message_pump.py:697
Mount() >>> ToastRack(id='textual-toastrack') method=<Widget.on_mount>
...
RowHighlighted(cursor_row=0, row_key=<textual.widgets._data_table.RowKey object at 0x7fc8d98800d0>) >>> BrowserApp(title='Race Runners', classes={'-dark-mode'}) method=None
[18:28:17] EVENT                                                                                                                                                 message_pump.py:697
Mount() >>> ScrollBarCorner() method=<Widget.on_mount>
[18:28:17] EVENT                                                                                                                                                 message_pump.py:706
Resize(size=Size(width=2, height=1), virtual_size=Size(width=178, height=47), container_size=Size(width=178, height=47)) >>> ScrollBarCorner() method=None
[18:28:17] EVENT                                                                                                                                                 message_pump.py:706
Show() >>> ScrollBarCorner() method=None
Using unittest and Pilot
The framework has the Pilot class, that can be used to make automated calls to Textual Widgets and wait for events, so you can simulate user interaction with the application to validate it behaves as expected:
import unittest
from textual.widgets import DataTable, MarkdownViewer
from empirestaterunup.apps import BrowserApp


class AppTestCase(unittest.IsolatedAsyncioTestCase):
    async def test_browser_app(self):
        app = BrowserApp()
        self.assertIsNotNone(app)
        async with app.run_test() as pilot:

            """
            Test the command palette
            """
            await pilot.press("ctrl+\\")
            for char in "jose".split():
                await pilot.press(char)
            await pilot.press("enter")
            # This returns the runner screen, check it has some contents
            markdown_viewer = app.screen.query(MarkdownViewer).first()
            self.assertTrue(markdown_viewer.document)
            await pilot.click("#close")  # Close the new screen, pop the original one
            # Go back to the main screen, now select a runner but using the table
            table = app.screen.query(DataTable).first()
            coordinate = table.cursor_coordinate
            self.assertTrue(table.is_valid_coordinate(coordinate))
            await pilot.press("enter")
            await pilot.pause()
            markdown_viewer = app.screen.query(MarkdownViewer).first()
            self.assertTrue(markdown_viewer)
            # After validating the markdown one more time, close the app
            # Quit the app by pressing q
            await pilot.press("q")

if __name__ == '__main__':
    unittest.main()
This is invaluable, and something that many times requires an external toolset to validate (for example in Java you have the class Robot).
Running the applications
Finally, time to get familiar with the applications (you can see an animated demonstration of the TUI applications here)
Browsing through the data
The ‘esru_browser’ is a simple browser that lets you navigate through the race raw data.
esru_browser
The application shows all the race details for every Runner, on a table that allows sorting by column.
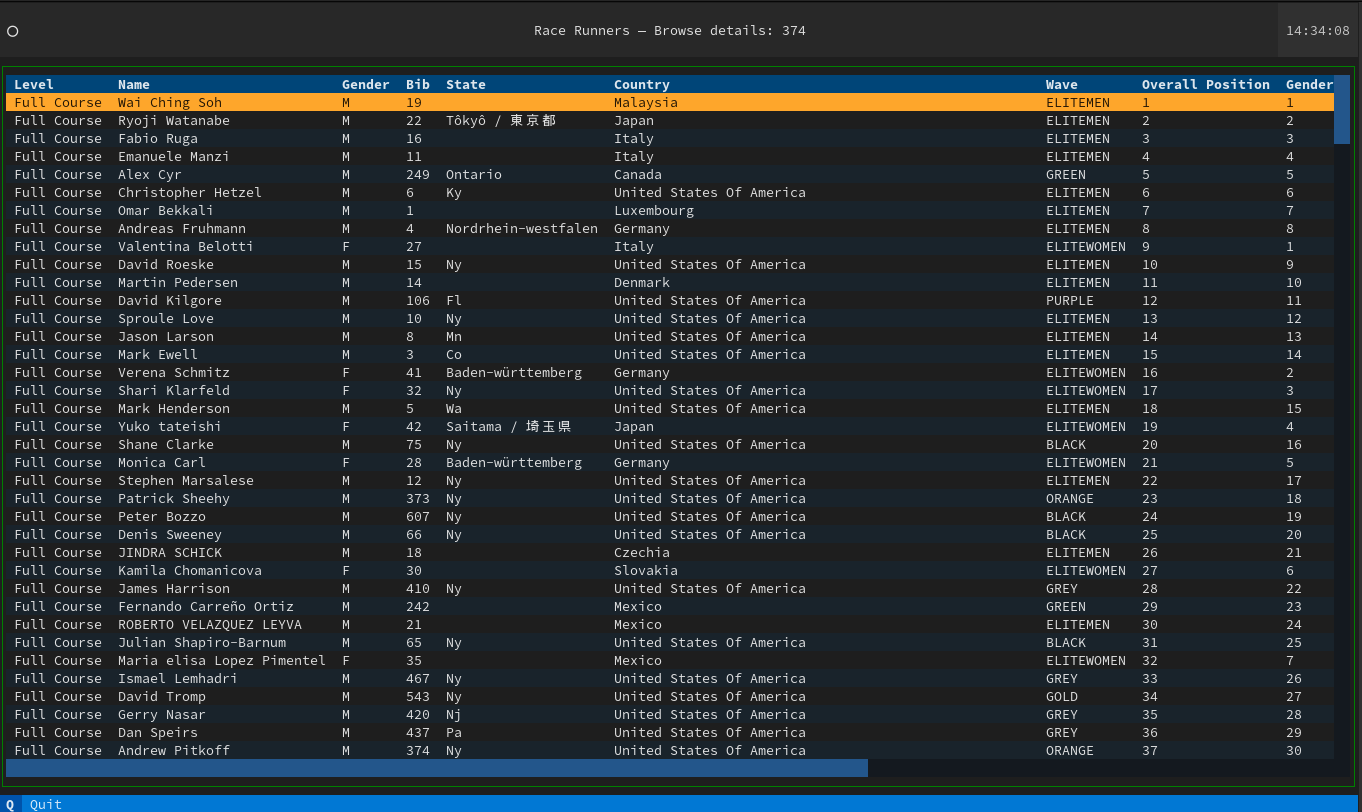
And the command palette, searching for runners by name:

Summary reports
This application provides details about the following:
- Count, standard deviation, mean, min, max 45%, 50%, and 75% for age, time, and pace
- Group and count distribution for Age, Wave, and Gender
esru_numbers
Some interesting facts about the race:
- Average age is 41 years old and 40 years old is the largest age group
- The majority number of people belonged to the ‘BLACK WAVE’
- The majority of the people finished the race between 20 and 30 minutes.
- The youngest runner was 11 years old, oldest was 78

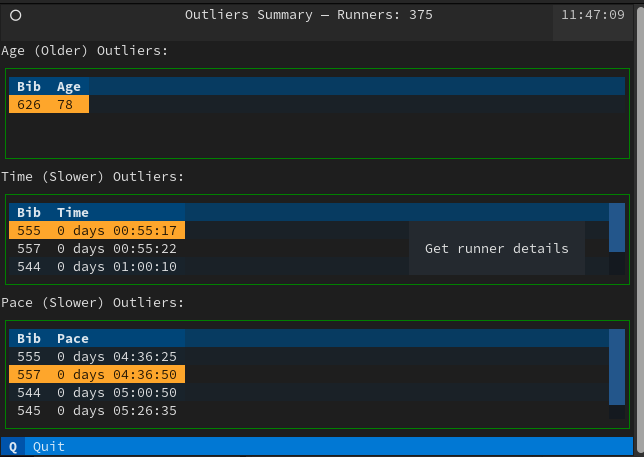
Finding outliers
This application uses the Z-score to find the outliers for several metrics for this race
esru_outlier

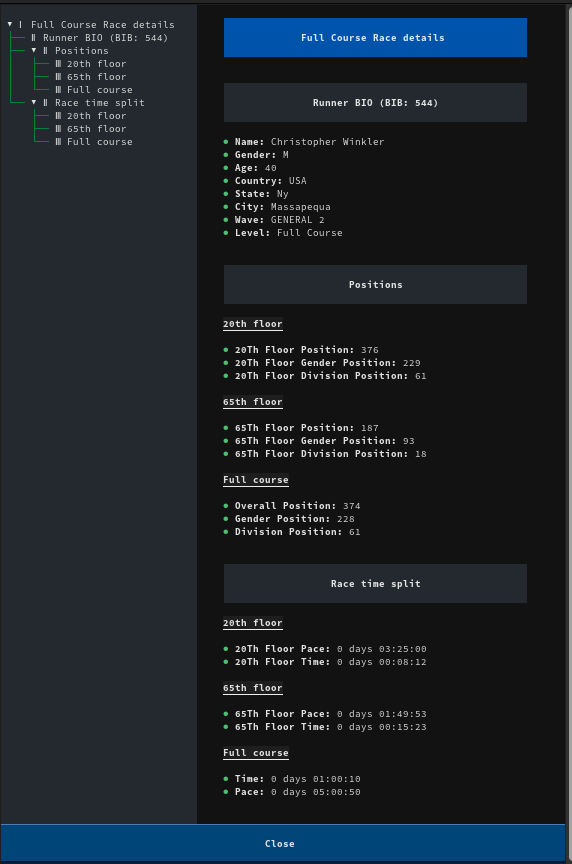
Because these results drill down to the BIB number, you can click on a row and get more details about a runner:

Textual as excellent support for rendering Markdown, programming languages. Take a look at the code to see yourself.
A few plot graphics for you
The esru_plot application offers a few plot graphics to help you visualize the data. Inside, the class Plotter does all the heavy lifting
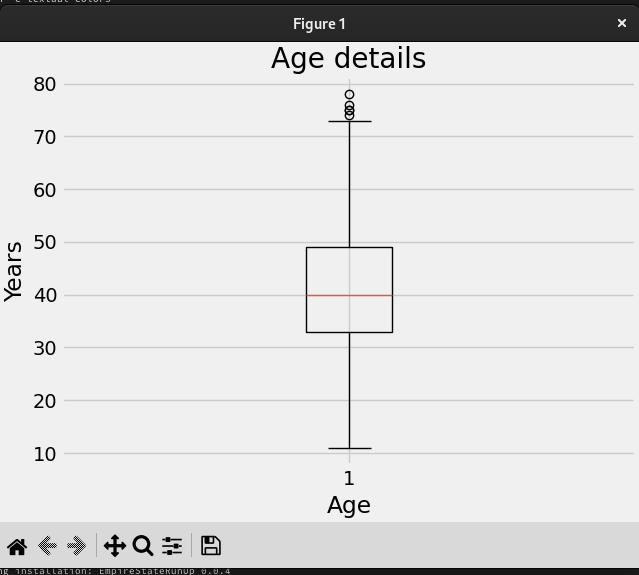
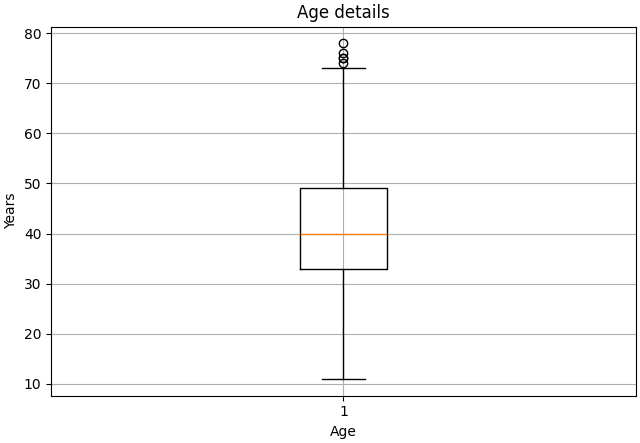
Age plots
The program can generate two flavors for the same data, one is a Box diagram:
The second is a regular histogram:
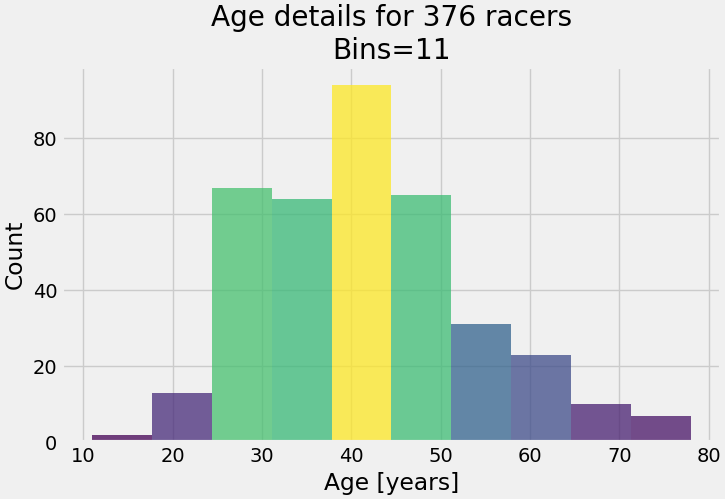
You can see from both graphics that the group age with the most participants is the 40-45-year-old bracket and the outliers are in the 10-20 and 70-80 year old groups.
Participants per country plot
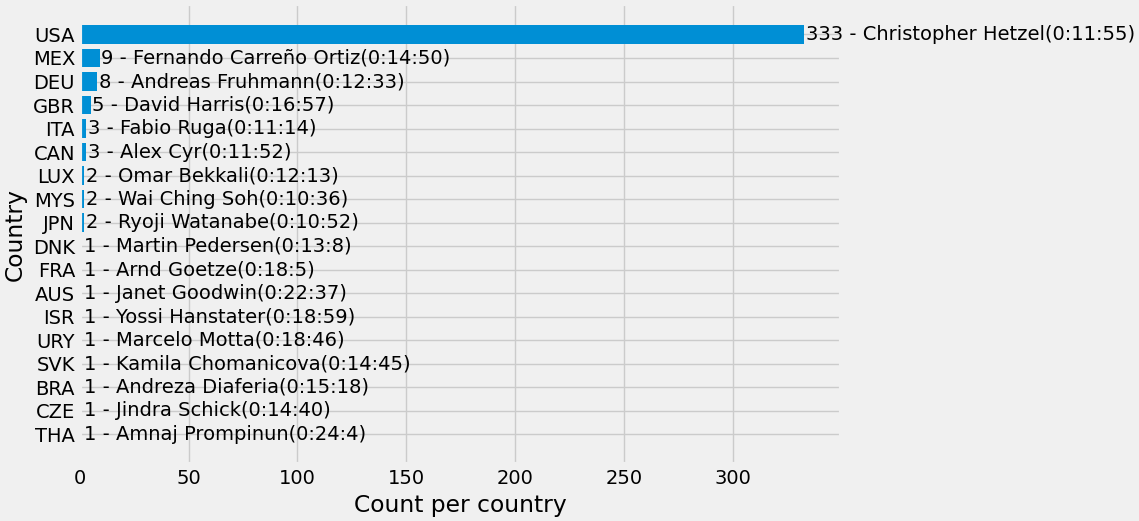
No surprises here, the overwhelming majority of racers come from the United States, followed by Mexico. Interestingly the winner of the 2013 race is from Malaysia, with only 2 runners participating.
Gender distribution
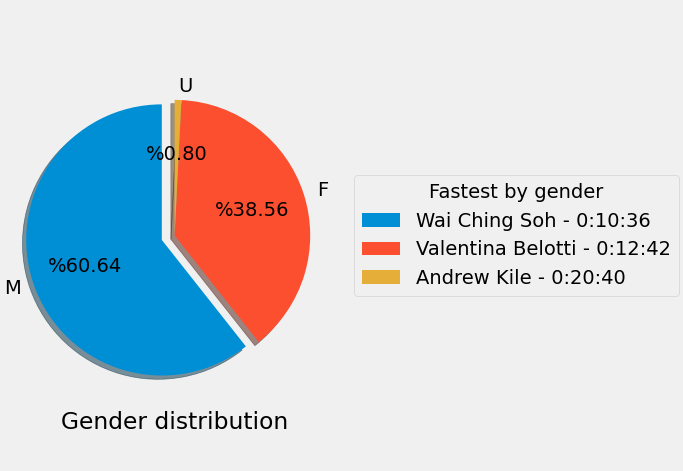
The majority of the runners identified themselves as Males, followed by Females.
What is next?
Participating in this race was a great experience, and the best part was that of fueled my curiosity and let me write this code to find more interesting facts about the race.
There is plenty more to learn about the tools you just saw in this tutorial:
- There are a lot of race public datasets, you can apply what you learned here. Just take a look at this dataset of the New York City Marathon, period 1970-2018. What other questions you can ask about the data?
- You saw just the tip of what you can do with Textual. I encourage you to explore the apps.py module. Take a look at the example applications.
- Selenium Web driver is not a tool for web scraping but for automated testing of web applications. It doesn’t get better than having your browser perform automated testing for you. It is a big framework, so be prepared to spend time reading and running your tests. I strongly suggest you look at the examples.
- Apply for the Empire Estate Run Up lottery or run through a charity, if you like this kind of race. Who said King Kong is the only one who could make it to the top?
- Sadly I’m not in a position to offer you any training advice. Every person is different. I do recommend you check with your doctor before you participate in a race like this (make sure the plumbing is good as they say), and get some professional advice from a running coach.
- But most important of all, believe you can do this (the race and writing some tools to process the race data) and have fun while doing it. This is a pre-requisite for any project.