Glances and InfluxDB for monitoring and troubleshooting

Imagine the following situation: You are trying to figure out why one of your applications is not performing well.
The application logs do not show a specific issue and by the time you got to check the server the problem was “gone”.
Most likely you want to record performance for a given period of time to see what metrics deteriorated on the machine, to make things interesting you don’t have a dedicated agent taking care of that.
There are tools that are perfect showing the health of the server in real time, like HTOP and Glances. However, what sets Glances apart from other tools is that it can record metrics to a remote agent while also showing them to you on real time.
Then comes the issue of sharing this information with other team members and being able to go through all this metrics in the form of time series. That’s where a database solution like InfluxDB, which integrates well with many other programs, comes into play.
What will you learn on this article
The idea is to setup an observability solution the quickest way possible, so you can capture the problem while it is still happening.
You will learn to do the following:
- Install Glances using a Python virtual environment
- Install InfluxDB using a podman container
- Connect the InfluxDB and Glances so the historic metrics are recorded.
Let’s move on with the installation of these tools
Installing Glances and InfluxDB
On the machine where you want to capture the metrics, install Glances, with the InfluxDB Python client:
[josevnz@server1 ~]$ python3 -m venv ~/virtualenv/glances
[josevnz@server1 ~]$ . ~/virtualenv/glances/bin/activate
(glances) [josevnz@server1 ~]$ pip install wheel
(glances) [josevnz@server1 ~]$ pip install --upgrade glances[all]
Collecting glances
  Downloading Glances-3.3.1.1-py3-none-any.whl (708 kB)
     ━━━━━━━━━━━━━━━━━━━━━━━━━━━━━━━━━━━━━━━━ 708.4/708.4 kB 6.7 MB/s eta 0:00:00
Collecting psutil>=5.6.7
  Downloading psutil-5.9.4-cp36-abi3-manylinux_2_12_x86_64.manylinux2010_x86_64.manylinux_2_17_x86_64.manylinux2014_x86_64.whl (280 kB)
     ━━━━━━━━━━━━━━━━━━━━━━━━━━━━━━━━━━━━━━━━ 280.2/280.2 kB 9.7 MB/s eta 0:00:00
Collecting defusedxml
  Downloading defusedxml-0.7.1-py2.py3-none-any.whl (25 kB)
Collecting packaging
  Using cached packaging-23.0-py3-none-any.whl (42 kB)
Collecting ujson>=5.4.0
  Downloading ujson-5.7.0-cp311-cp311-manylinux_2_17_x86_64.manylinux2014_x86_64.whl (52 kB)
     ━━━━━━━━━━━━━━━━━━━━━━━━━━━━━━━━━━━━━━━━ 52.8/52.8 kB 6.7 MB/s eta 0:00:00
Installing collected packages: ujson, psutil, packaging, defusedxml, glances
Successfully installed defusedxml-0.7.1 glances-3.3.1.1 packaging-23.0 psutil-5.9.4 ujson-5.7.0
...
Then install the InfluxDB client, which will allow Glances to export the metrics directly to InfluxDB
pip install influxdb-client
Requirement already satisfied: six>=1.5 in ./virtualenv/glances/lib64/python3.11/site-packages (from python-dateutil>=2.5.3->influxdb-client) (1.16.0)
Collecting typing-extensions<5.0.0,>=4.1.1
  Using cached typing_extensions-4.5.0-py3-none-any.whl (27 kB)
Installing collected packages: typing-extensions, reactivex, influxdb-client
Successfully installed influxdb-client-1.36.1 reactivex-4.0.4 typing-extensions-4.5.0
Then you will pick a machine that will store the metrics for later analysis with InfluxDB:
josevnz@server2:~$ podman run --name mydb --detach --publish 8086:8086 --volume $PWD/data/influxdb:/var/lib/influxdb2 influxdb:latest --reporting-disabled
87cd8aae2b9af65a1c10be530e699b5f54026d8ca2b66bd0890a49a30c643853
josevnz@server2:~$ podman logs mydb
Command "print-config" is deprecated, use the influx-cli command server-config to display the configuration values from the running server
Command "print-config" is deprecated, use the influx-cli command server-config to display the configuration values from the running server
Command "print-config" is deprecated, use the influx-cli command server-config to display the configuration values from the running server
2023-03-18T21:57:19.388287863Z	warn	boltdb not found at configured path, but DOCKER_INFLUXDB_INIT_MODE not specified, skipping setup wrapper	{"system": "docker", "bolt_path": ""}
...
Next step is to initialize the database. I prefer to follow the wizard:
josevnz@server2:~$ podman exec --tty --interactive mydb /bin/bash
root@cd378ef1f5c3:/# influx setup
> Welcome to InfluxDB 2.0!
? Please type your primary username josevnz
? Please type your password *********
? Please type your password again *********
? Please type your primary organization name KodeGeek
? Please type your primary bucket name glances
? Please type your retention period in hours, or 0 for infinite 0
? Setup with these parameters?
  Username:   josevnz
  Organization:KodeGeek
  Bucket:     glances
  Retention Period:  infinite
 Yes
User	Organization	Bucket
josevnz	KodeGeek	glances
root@cd378ef1f5c3:/#
While you are still on the container we will create an ‘all-access’ token that we will use to provide access to our database:
root@cd378ef1f5c3:/# influx auth create \
  --org KodeGeek \
  --read-authorizations \
  --write-authorizations \
  --read-buckets \
  --write-buckets \
  --read-dashboards \
  --write-dashboards \
  --read-tasks \
  --write-tasks \
  --read-telegrafs \
  --write-telegrafs \
  --read-users \
  --write-users \
  --read-variables \
  --write-variables \
  --read-secrets \
  --write-secrets \
  --read-labels \
  --write-labels \
  --read-views \
  --write-views \
  --read-documents \
  --write-documents \
  --read-notificationRules \
  --write-notificationRules \
  --read-notificationEndpoints \
  --write-notificationEndpoints \
  --read-checks \
  --write-checks \
  --read-dbrp \
  --write-dbrp \
  --read-annotations \
  --write-annotations \
  --read-sources \
  --write-sources \
  --read-scrapers \
  --write-scrapers \
  --read-notebooks \
  --write-notebooks \
  --read-remotes \
  --write-remotes \
  --read-replications \
  --write-replications
ID			Description	Token												User Name	User ID			Permissions
0ae9b2f1ea468000			F8y7eoaPX5gMkWvpxZ-b2LOnJjMO6gdH1ba1HfQV0dXmJm6oBekA7WsPiPk-3zhOxL8Y55_aJB1Ii-kRBDsH6w==	josevnz		0ae9b2131d868000	[read:orgs/b38ef4c091e3eca2/authorizations write:orgs/b38ef4c091e3eca2/authorizations read:orgs/b38ef4c091e3eca2/buckets write:orgs/b38ef4c091e3eca2/buckets read:orgs/b38ef4c091e3eca2/dashboards write:orgs/b38ef4c091e3eca2/dashboards read:orgs/b38ef4c091e3eca2/tasks write:orgs/b38ef4c091e3eca2/tasks read:orgs/b38ef4c091e3eca2/telegrafs write:orgs/b38ef4c091e3eca2/telegrafs read:/users write:/users read:orgs/b38ef4c091e3eca2/variables write:orgs/b38ef4c091e3eca2/variables read:orgs/b38ef4c091e3eca2/secrets write:orgs/b38ef4c091e3eca2/secrets read:orgs/b38ef4c091e3eca2/labels write:orgs/b38ef4c091e3eca2/labels read:orgs/b38ef4c091e3eca2/views write:orgs/b38ef4c091e3eca2/views read:orgs/b38ef4c091e3eca2/documents write:orgs/b38ef4c091e3eca2/documents read:orgs/b38ef4c091e3eca2/notificationRules write:orgs/b38ef4c091e3eca2/notificationRules read:orgs/b38ef4c091e3eca2/notificationEndpoints write:orgs/b38ef4c091e3eca2/notificationEndpoints read:orgs/b38ef4c091e3eca2/checks write:orgs/b38ef4c091e3eca2/checks read:orgs/b38ef4c091e3eca2/dbrp write:orgs/b38ef4c091e3eca2/dbrp read:orgs/b38ef4c091e3eca2/annotations write:orgs/b38ef4c091e3eca2/annotations read:orgs/b38ef4c091e3eca2/sources write:orgs/b38ef4c091e3eca2/sources read:orgs/b38ef4c091e3eca2/scrapers write:orgs/b38ef4c091e3eca2/scrapers read:orgs/b38ef4c091e3eca2/notebooks write:orgs/b38ef4c091e3eca2/notebooks read:orgs/b38ef4c091e3eca2/remotes write:orgs/b38ef4c091e3eca2/remotes read:orgs/b38ef4c091e3eca2/replications write:orgs/b38ef4c091e3eca2/replications]
The important piece is our fresh new token: (F8y7eoaPX5gMkWvpxZ-b2LOnJjMO6gdH1ba1HfQV0dXmJm6oBekA7WsPiPk-3zhOxL8Y55_aJB1Ii-kRBDsH6w==)
Keep it safe, we will use it shortly to allow Glances to connect.
Connecting InfluxDB and Glances
Glance expects to have its configuration in one or more locations, for this example I will use ~/.config/glances/glances.conf with InfluxDB settings, on server1 (the machine with problems):
mkdir ~/.config/glances/
/bin/cat<<GLANCES>~/.config/glances/glances.conf
[global]
refresh=2
check_update=false
history_size=28800
[influxdb2]
# server2 is where InfluxDB is running
host=server2
port=8086
protocol=http
org=KodeGeek
bucket=glances
# And here you put the tocket we generated on the previous step
token=F8y7eoaPX5gMkWvpxZ-b2LOnJjMO6gdH1ba1HfQV0dXmJm6oBekA7WsPiPk-3zhOxL8Y55_aJB1Ii-kRBDsH6w==
GLANCES
Capturing the metrics
Time capture those metrics. On your terminal type the following, after activating your virtual environment:
. ~/virtualenv/glances/bin/activate
glances -t 5 --export influxdb2
To simulate activity, I will run the sysbench application:
[josevnz@server1 Downloads]$ sudo dnf install -y sysbench
[josevnz@server1 Downloads]$ for i in $(seq 10); do sysbench --test=cpu run; done

Watching the results
Glances is excellent showing us several metrics in real time, but now let’s see how they look as a time series:
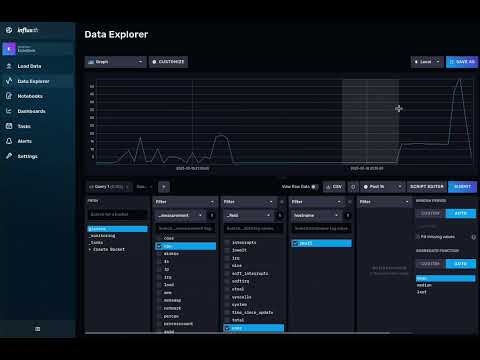
As you can see, Glances created several metrics and tags on the Glances bucket we defined on the configuration.
Conclusion
- Traditional tools like SAR are very useful to capture metrics, but newer tools have more flexibility and options. Glances is written in Python and supports a server mode, which means you can write your own tools on top of it.
- Glances and InfluxDB are a great combination to monitor and troubleshoot system issues. They are very easy to install, work well together and better are easy to use, which will help you focus on solving your performance issue.
- Both Glances and InfluxDB have a vibrant community, if you run into trouble with them, you will find help quickly.
- I briefly mention sysbench. There are other benchmark tools that you can run, and they could help you indicate a bottleneck with your system.