Monitoring Linux Systems With InfluxDB
InfluxDB offers very complete query capabilities, and it is also pretty good at storing time series data. On this article I will demonstrate how you can use existing performance collection tools with InfluxDB as the storage of the captured metrics.
What you will require for this tutorial
- A Docker or Podman installation, so you can run and instance of Influxdb; you can also do a bare metal installation, but I won’t cover that here and instead will use a container.
- Influxdb 2.7.4 or better.
- A linux distribution. I used Fedora Linux.
- Python3 and some experience writing scripts.
Running an Influxdb server from a container
This is maybe the easiest way to get you started; We will use an external volume to persist the data across container reboots and upgrades (please check the container page to see all the possible options):
podman pull influxdb:latest
podman run --detach --volume /data/influxdb:/var/lib/influxdb --volumne /data:/data:rw  --name influxdb_raspberrypi --restart always --publish 8086:8086 influxdb:latest --reporting-disabled
podman logs --follow influxdb_raspberrypi
If you run this container on Fedora or Red Hat Enterprise Linux (RHEL), use option Z when mounting a volume to ensure it receives the correct SELinux labels.
Our running container is called ‘influxdb_raspberrypi’, and with the podman logs command we do a quick check to make sure there are no errors.
Integration with Prometheus
What is Prometheus?
Prometheus is an open source systems monitoring and alerting toolkit originally built at SoundCloud by ex-Googlers who wanted to monitor metrics on their servers and applications.
The InfluxDB website has good documentation that explains how to integrate Prometheus with InfluxDB as the database backend/
Setting up the node-exporter agent
We will run a program called node-exporter, who will be responsible for catpuring Linux metrics:
curl --location --silent --output ~josevnz/Downloads/node_exporter-1.7.0.linux-amd64.tar.gz --fail https://github.com/prometheus/node_exporter/releases/download/v1.7.0/node_exporter-1.7.0.linux-amd64.tar.gz
sudo tar --directory /opt --extract --verbose --file ~josevnz/Downloads/node_exporter-1.7.0.linux-amd64.tar.gz
rm ~/Downloads/node_exporter-1.7.0.linux-amd64.tar.gz
Then to make it easier to start automatically across reboots, we create a systemd unit:
sudo useradd --system --comment  'Prometheus account' --no-create-home --shell /sbin/nologin prometheus
sudo chown -R prometheus /opt/prometheus
sudo EDITOR=vi systemctl edit --force --full node_exporter.service
And then save the following:
[Unit]
Description=Node exporter Server
Documentation=https://prometheus.io/docs/guides/node-exporter/
After=network-online.target

[Service]
Restart=always
User=prometheus
EnvironmentFile=/etc/default/prometheus-node-exporter
ExecStart=/opt/prometheus/node_exporter-1.7.0.linux-amd64/node_exporter $ARGS
ExecReload=/bin/kill -HUP $MAINPID
TimeoutStopSec=20s
SendSIGKILL=no

[Install]
WantedBy=multi-user.target
Bring it up:
# Basic settings for the exporter
sudo echo 'ARGS="--web.listen-address=:9100"' > /etc/default/prometheus-node-exporter
# Enable the service
sudo systemctl daemon-reload
sudo systemctl enable --now node_exporter.service
[josevnz@dmaf5 MonitoringWithInfluxDB]$ sudo systemctl status node_exporter.service
● node_exporter.service - Node exporter Server
     Loaded: loaded (/etc/systemd/system/node_exporter.service; enabled; preset: disabled)
     Active: active (running) since Sun 2023-12-03 07:43:39 EST; 6h ago
       Docs: https://prometheus.io/docs/guides/node-exporter/
   Main PID: 1624 (node_exporter)
      Tasks: 5 (limit: 18743)
     Memory: 18.0M
        CPU: 44ms
     CGroup: /system.slice/node_exporter.service
             └─1624 /opt/prometheus/node_exporter-1.5.0.linux-amd64/node_exporter --web.listen-address=:9100
Then you can open your browser on http://localhost:9100. For example, using curl:
[josevnz@dmaf5 MonitoringWithInfluxDB]$ curl --fail --silent http://dmaf5:9100/metrics
# HELP go_gc_duration_seconds A summary of the pause duration of garbage collection cycles.
# TYPE go_gc_duration_seconds summary
go_gc_duration_seconds{quantile="0"} 3.228e-05
go_gc_duration_seconds{quantile="0.25"} 3.228e-05
go_gc_duration_seconds{quantile="0.5"} 5.1216e-05
go_gc_duration_seconds{quantile="0.75"} 5.1216e-05
go_gc_duration_seconds{quantile="1"} 5.1216e-05
go_gc_duration_seconds_sum 8.3496e-05
go_gc_duration_seconds_count 2
# HELP go_goroutines Number of goroutines that currently exist.
# TYPE go_goroutines gauge
go_goroutines 8
# HELP go_info Information about the Go environment.
# TYPE go_info gauge
go_info{version="go1.19.3"} 1
Connecting Prometheus with node-exporter
Prometheus is in charge is collecting metrics from agents on our Linux machine, like node-exporter, and other servers too!. Time to install it:
curl --fail --silent --location --output ~/Downloads/prometheus-2.45.1.linux-amd64.tar.gz  https://github.com/prometheus/prometheus/releases/download/v2.45.1/prometheus-2.45.1.linux-amd64.tar.gz && echo OK|| echo FAIL
sudo tar --extract --file --verbose ~josevnz/Downloads/prometheus-2.45.1.linux-amd64.tar.gz
sudo chown -R prometheus /opt/prometheus-2.45.1.linux-amd64
rm ~/Downloads/prometheus-2.45.1.linux-amd64.tar.gz
Prometheus needs details where to scrape the data, we define settings like this:
sudo vi /etc/prometheus/prometheus.yaml
The resulting /etc/prometheus/prometheus.yaml file:
---
global:
    scrape_interval: 30s
    evaluation_interval: 30s
    scrape_timeout: 10s
    external_labels:
        monitor: 'nunez-family-monitor'

scrape_configs:
    - job_name: 'node-exporter'
      static_configs:
          - targets: ['dmaf5.home:9100']
I strongly recommend you validate your basic syntax using yamllint /etc/prometheus/prometheus.yaml.
Once the favourite editor is open (I use vim), you can then define the following systemd unit for it:
sudo EDITOR=vi systemctl edit --force --full prometheus.service
Then add the following:
[Unit]
Description=Prometheus Server
Documentation=https://prometheus.io/docs/guides/
After=network-online.target

[Service]
Restart=always
User=prometheus
EnvironmentFile=/etc/default/prometheus-node-exporter
ExecStart=/opt/prometheus-2.45.1.linux-amd64/prometheus $ARGS
ExecReload=/bin/kill -HUP $MAINPID
TimeoutStopSec=20s
SendSIGKILL=no

[Install]
WantedBy=multi-user.target
Enable it and check the logs:
sudo systemctl daemon-reload
sudo systemctl enable prometheus.service --now
[josevnz@dmaf5 MonitoringWithInfluxDB]$ sudo systemctl status prometheus.service
● prometheus.service - Prometheus Server
     Loaded: loaded (/etc/systemd/system/prometheus.service; enabled; preset: disabled)
     Active: active (running) since Sun 2023-12-03 14:59:13 EST; 4s ago
       Docs: https://prometheus.io/docs/guides/
   Main PID: 34580 (prometheus)
      Tasks: 13 (limit: 18743)
     Memory: 15.5M
        CPU: 107ms
     CGroup: /system.slice/prometheus.service
             └─34580 /opt/prometheus-2.45.1.linux-amd64/prometheus --config.file /etc/prometheus/prometheus.yaml --storage.tsdb.path=/opt/prometheus-2.45.1.linux-amd64/data
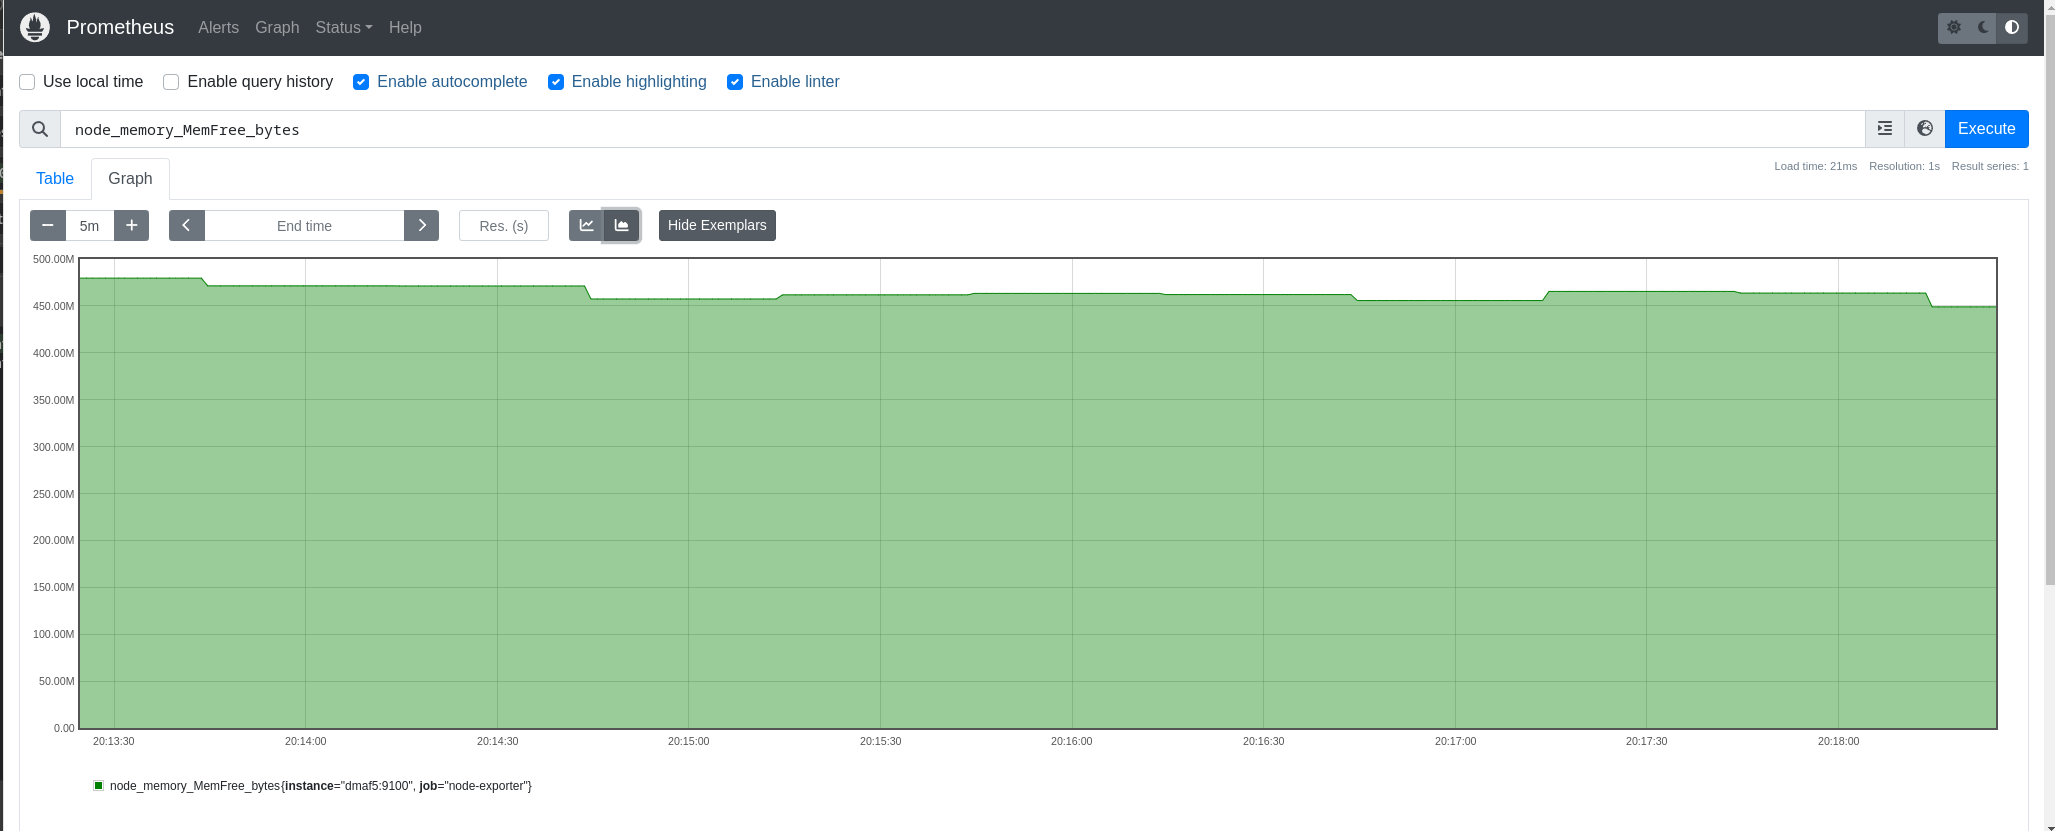
We can check now the Prometheus web interface on http://dmaf5:9090 (note that we connect to Prometheus and not node-exporter directly):
Connecting Prometheus with InfluxDB
Prometheus cannot talk directly with InfluxDB 2.xx, so we need a third component, it is called ‘Telegraf’ and we will install it next:
curl --location --fail --silent --output ~josevnz/Downloads/telegraf-1.28.5_linux_amd64.tar.gz  https://dl.influxdata.com/telegraf/releases/telegraf-1.28.5_linux_amd64.tar.gz
sudo tar --extract --verbose --directory /opt --file ~josevnz/Downloads/telegraf-1.28.5_linux_amd64.tar.gz
sudo useradd --system --comment  'Telegraf account' --no-create-home --shell /sbin/nologin telegraf
sudo mkdir -p /etc/telegraf/
sudo touch /etc/default/telegraf /etc/telegraf/telegraf.conf
sudo chown -R telegraf /opt/telegraf-1.28.5 /etc/telegraf /etc/default/telegraf
I borrowed the systemd unit from Telegraf:
sudo EDITOR=vi systemctl edit --full --force telegraf.service
The resulting systemd unit:
[Unit]
Description=Telegraf
Documentation=https://github.com/influxdata/telegraf
After=network-online.target
Wants=network-online.target

[Service]
Type=notify
EnvironmentFile=-/etc/default/telegraf
User=telegraf
ImportCredential=telegraf.*
ExecStart=/opt/telegraf-1.28.5/usr/bin/telegraf -config /etc/telegraf/telegraf.conf -config-directory /etc/telegraf/telegraf.d $TELEGRAF_OPTS
ExecReload=/bin/kill -HUP $MAINPID
Restart=on-failure
RestartForceExitStatus=SIGPIPE
KillMode=mixed
TimeoutStopSec=5
LimitMEMLOCK=8M:8M
PrivateMounts=true

[Install]
WantedBy=multi-user.target
Telegraph can scrape data directly from Node exporter without talking to Prometheus , and then it can relay it back to InfluxDB. Telegraf is the glue that will allow us to connect together both services.
We need to store the data into a bucket and also an authentication token is required. Both can be created on the command line as follows (using the InfluxDB docker container):
josevnz@raspberrypi:~$ podman exec --tty --interactive influxdb_raspberrypi /bin/bash
root@raspberrypi:/#
# Create a bucket called 'prometheus'
root@raspberrypi:/# influx bucket create --org Kodegeek --name prometheus  --description 'Prometheus storage' --retention 0
ID			Name		Retention	Shard group duration	Organization ID		Schema Type
5efea066b05e584d	prometheus	infinite	168h0m0s		c334619ae2cd7b3d	implicit
# Now create an authentication token for the new bucket, id = 5efea066b05e584d
root@raspberrypi:/# influx auth create --org Kodegeek --description 'Authorization for Prometheus' --write-bucket 5efea066b05e584d --read-bucket 5efea066b05e584d --write-buckets --read-buckets
ID			Description			Token												User Name	User ID			Permissions
0c49edb275400000	Authorization for Prometheus	bo1-N1Ythhpxj0oAh14TDfEM66Ty0Iz7bmLkxEcUdune3pSj8Or7Lzoe-PCWr-yqyabxBukOIurjdTnSCSsUFw==	josevnz		09ff917433270000	[read:orgs/c334619ae2cd7b3d/buckets/5efea066b05e584d write:orgs/c334619ae2cd7b3d/buckets/5efea066b05e584d read:orgs/c334619ae2cd7b3d/buckets write:orgs/c334619ae2cd7b3d/buckets]
Time to connect Telegraf with the InfluxDB instance. This requires changes on /etc/telegraf/telegraf.conf running on dmaf5:
## Collect Node-exporter Prometheus formatted metrics on dmaf5. In this case node-exporter service
## http://dmaf5:9100/metrics (Node exporter) != http://dmaf5:9090/metrics Prometheus scrapper
[[inputs.prometheus]]
  urls = ["http://dmaf5:9100/metrics"]
  metric_version = 2

## Write Prometheus formatted metrics to InfluxDB prometheus bucket
[[outputs.influxdb_v2]]
  urls = ["http://raspberrypi:8086"]
  token = "bo1-N1Ythhpxj0oAh14TDfEM66Ty0Iz7bmLkxEcUdune3pSj8Or7Lzoe-PCWr-yqyabxBukOIurjdTnSCSsUFw=="
  organization = "Kodegeek"
  bucket = "prometheus"
Now connect our Prometheus installation with Telegraf:
systemctl daemon-reload
systemctl enable telegraf.service --now
Confirm that is running:
[root@dmaf5 ~]# systemctl enable telegraf.service --now
[root@dmaf5 ~]# systemctl status telegraf.service
● telegraf.service - Telegraf
     Loaded: loaded (/etc/systemd/system/telegraf.service; enabled; preset: disabled)
     Active: active (running) since Sun 2023-12-17 07:28:07 EST; 7s ago
       Docs: https://github.com/influxdata/telegraf
   Main PID: 9290 (telegraf)
      Tasks: 13 (limit: 18743)
     Memory: 217.6M
        CPU: 303ms
     CGroup: /system.slice/telegraf.service
             ├─9290 /opt/telegraf-1.28.5/usr/bin/telegraf -config /etc/telegraf/telegraf.conf -config-directory /etc/telegraf/telegraf.d
             └─9305 /usr/bin/dbus-daemon --syslog --fork --print-pid 4 --print-address 6 --session

Dec 17 07:28:07 dmaf5 telegraf[9290]: 2023-12-17T12:28:07Z I! Available plugins: 240 inputs, 9 aggregators, 29 processors, 24 parsers, 59 outputs, 5 secret-stores
Dec 17 07:28:07 dmaf5 telegraf[9290]: 2023-12-17T12:28:07Z I! Loaded inputs: prometheus
Dec 17 07:28:07 dmaf5 telegraf[9290]: 2023-12-17T12:28:07Z I! Loaded aggregators:
Dec 17 07:28:07 dmaf5 telegraf[9290]: 2023-12-17T12:28:07Z I! Loaded processors:
Dec 17 07:28:07 dmaf5 telegraf[9290]: 2023-12-17T12:28:07Z I! Loaded secretstores:
Dec 17 07:28:07 dmaf5 telegraf[9290]: 2023-12-17T12:28:07Z I! Loaded outputs: influxdb_v2
Dec 17 07:28:07 dmaf5 telegraf[9290]: 2023-12-17T12:28:07Z I! Tags enabled: host=dmaf5
Dec 17 07:28:07 dmaf5 telegraf[9290]: 2023-12-17T12:28:07Z I! [agent] Config: Interval:10s, Quiet:false, Hostname:"dmaf5", Flush Interval:10s
Dec 17 07:28:07 dmaf5 telegraf[9290]: 2023-12-17T12:28:07Z I! [inputs.prometheus] Using the label selector:  and field selector:
Dec 17 07:28:07 dmaf5 systemd[1]: Started telegraf.service - Telegraf.
Now we can check on the InfluxDB GUI some of the captured metrics, using the Data explorer menu. For example, number of bytes read from my NVME drives:
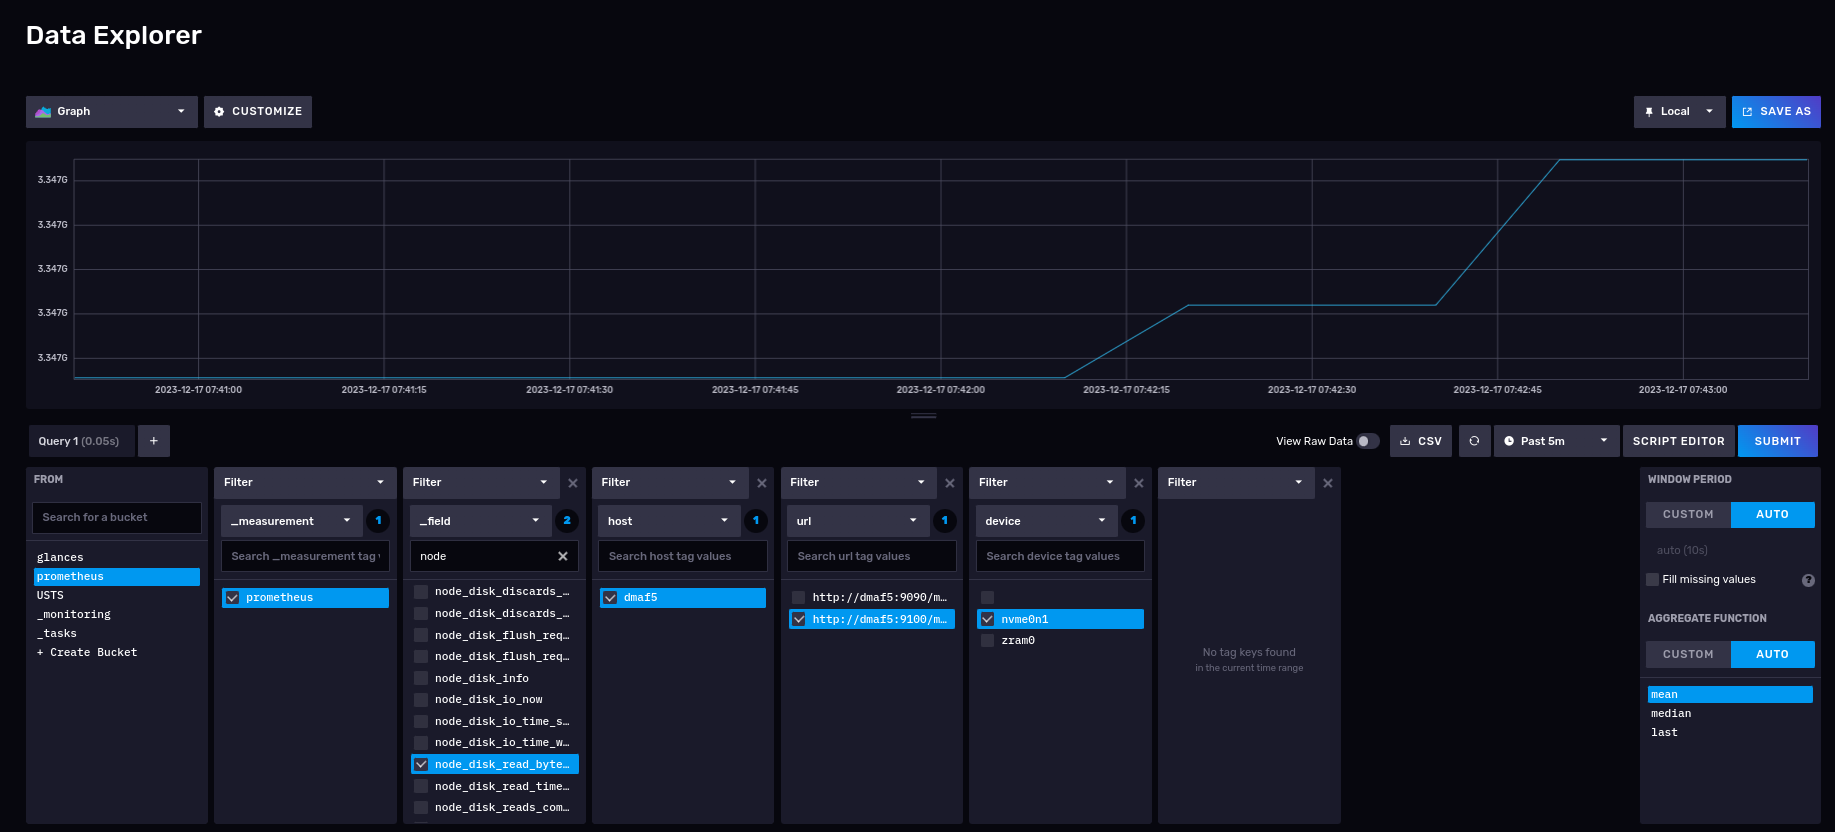
As you can see we can now skip using the Prometheus scrapper with no changes to your existing Prometheus configuration, instead we let Telegraf collect the data for us directly into the InfluxDB database.
But, are these the only integration possible with InfluxDB?
Integration with Glances
Glances is another great monitoring tool, written in Python, and it is a great alternative to Prometheus on the following scenarios:
1) Cannot deploy a node exporter agent because you lack the privileges, or have a company policy you must follow (like another agent running) 2) Want to get insight on the host performance but for limited time and don’t want to deal with a formal deployment. Run it for a while, then shut it down. 3) You already use Glances for monitoring and want to persist this information for later analysis.
Will show you next how you can integrate both tools.
A quick demonstration of Glances
Installation is pretty simple with pip:
[josevnz@dmaf5 ~]$ python -m venv ~/virtualenv/glances
[josevnz@dmaf5 ~]$ . ~/virtualenv/glances/bin/activate
(glances) [josevnz@dmaf5 ~]$ pip install --upgrade glance
...
Successfully installed glances-3.4.0.3
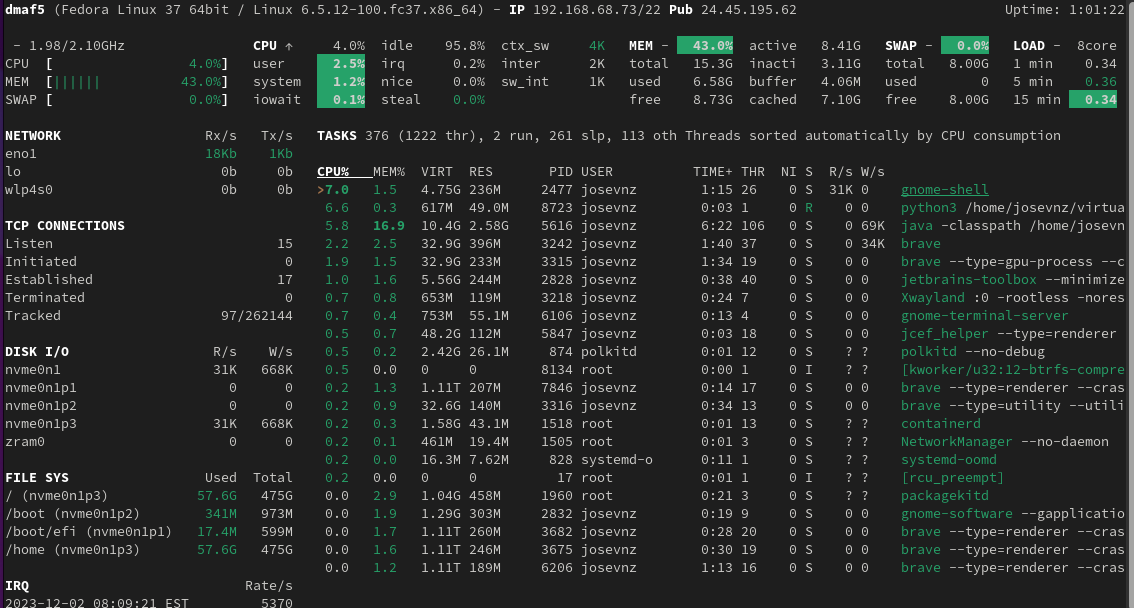
Normally you call glances without any options, to capture stats:
# Running in standalone mode
(glances) [josevnz@dmaf5 ~]$ glances
If we want to record out activity with Glances, we need to setup a InfluxDB, so it can accept our activity data.
Creating a Glances bucket to store our activity data
First step is to connect to our InfluxDB instance and create a bucket, I called mine glances.
Most likely you already have several buckets in your InfluxDB database, we will create a new bucket.
Get inside the influxdb_raspberrypi running container we will create a bucket, with a retention policy to keep our data forever:
josevnz@raspberrypi:~$ podman exec --tty --interactive influxdb_raspberrypi /bin/bash
root@raspberrypi:/# influx bucket create --org Kodegeek --name glances  --description 'Glances storage' --retention 0
ID			Name	Retention	Shard group duration	Organization ID		Schema Type
305430cf2f5de6fd	glances	infinite	168h0m0s		c334619ae2cd7b3d	implicit
Our bucket has the id ‘305430cf2f5de6fd’. We will use that to create an authorization token we can use to insert/ read data remotely from Glances:
josevnz@raspberrypi:~$ podman exec --tty --interactive influxdb_raspberrypi /bin/bash
root@raspberrypi:/# influx auth create --org Kodegeek --description 'Authorization for Glances' --write-bucket 305430cf2f5de6fd --read-bucket 305430cf2f5de6fd --write-buckets --read-buckets
ID			Description			Token												User Name	User ID			Permissions
0c37feccff400000	Authorization for Glances	UnmEgl1HQ7AiZB8_QrCJFYkm2tE_e82_Sd9jnkrMsj1nA0YONpazx2HHuoPK3b_GnP7WX2qNURDnUfvcQyfagw==	josevnz		09ff917433270000	[read:orgs/c334619ae2cd7b3d/buckets/305430cf2f5de6fd write:orgs/c334619ae2cd7b3d/buckets/305430cf2f5de6fd read:orgs/c334619ae2cd7b3d/buckets write:orgs/c334619ae2cd7b3d/buckets]
Here we got the authorization token ‘UnmEgl1HQ7AiZB8_QrCJFYkm2tE_e82_Sd9jnkrMsj1nA0YONpazx2HHuoPK3b_GnP7WX2qNURDnUfvcQyfagw==’. We will use it in our Glances configuration file:
Then we need to bridge glances with InfluxDB. For that we can add the following to the Glances configuration file:
mkdir ~/.config/glances/
/bin/cat<<GLANCES>~/.config/glances/glances.conf
[global]
refresh=2
check_update=false
history_size=28800
[influxdb2]
# server2 is where InfluxDB is running
host=raspberrypi
port=8086
protocol=http
org=KodeGeek
bucket=glances
# And here you put the token we generated on the previous step
token=UnmEgl1HQ7AiZB8_QrCJFYkm2tE_e82_Sd9jnkrMsj1nA0YONpazx2HHuoPK3b_GnP7WX2qNURDnUfvcQyfagw==
GLANCES
Install now the InfluxDB Python client, which allows Glances to export the metrics directly to InfluxDB:
(glances) [josevnz@dmaf5 MonitoringWithInfluxDB]$ pip install --upgrade influxdb-client
Requirement already satisfied: influxdb-client in /home/josevnz/virtualenv/glances/lib64/python3.11/site-packages (1.36.1)
Collecting influxdb-client
  Downloading influxdb_client-1.38.0-py3-none-any.whl (743 kB)
     ━━━━━━━━━━━━━━━━━━━━━━━━━━━━━━━━━━━━━━━━ 743.5/743.5 kB 8.1 MB/s eta 0:00:00
Requirement already satisfied: reactivex>=4.0.4 in /home/josevnz/virtualenv/glances/lib64/python3.11/site-packages (from influxdb-client) (4.0.4)
Requirement already satisfied: certifi>=14.05.14 in /home/josevnz/virtualenv/glances/lib64/python3.11/site-packages (from influxdb-client) (2022.12.7)
Requirement already satisfied: python-dateutil>=2.5.3 in /home/josevnz/virtualenv/glances/lib64/python3.11/site-packages (from influxdb-client) (2.8.2)
Requirement already satisfied: setuptools>=21.0.0 in /home/josevnz/virtualenv/glances/lib64/python3.11/site-packages (from influxdb-client) (67.6.0)
Requirement already satisfied: urllib3>=1.26.0 in /home/josevnz/virtualenv/glances/lib64/python3.11/site-packages (from influxdb-client) (1.26.15)
Requirement already satisfied: six>=1.5 in /home/josevnz/virtualenv/glances/lib64/python3.11/site-packages (from python-dateutil>=2.5.3->influxdb-client) (1.16.0)
Requirement already satisfied: typing-extensions<5.0.0,>=4.1.1 in /home/josevnz/virtualenv/glances/lib64/python3.11/site-packages (from reactivex>=4.0.4->influxdb-client) (4.5.0)
Installing collected packages: influxdb-client
  Attempting uninstall: influxdb-client
    Found existing installation: influxdb-client 1.36.1
    Uninstalling influxdb-client-1.36.1:
      Successfully uninstalled influxdb-client-1.36.1
Successfully installed influxdb-client-1.38.0
Now we just need to run Glances again:
. ~/virtualenv/glances/bin/activate
# Refresh every 5 seconds, export to influxdb2
glances --time 5 --export influxdb2
Make sure that you have set up your authorization configuration properly. On the InfluxDB container you should not see these:
podman logs --follow influxdb_raspberrypi
2023-12-03T13:10:49.944038Z	info	Unauthorized	{"log_id": "0lVhMguW000", "error": "authorization not found"}
2023-12-03T13:11:33.357711Z	info	Unauthorized	{"log_id": "0lVhMguW000", "error": "token required"}
Optionally you could run tshark and confirm that glances is making POST requests to the InfluxDB endpoint:
[josevnz@dmaf5 ~]$ tshark -i eno1 -Y http.request -f "host 192.168.68.60 and tcp port 8086"
Capturing on 'eno1'
 ** (tshark:18229) 09:58:47.993686 [Main MESSAGE] -- Capture started.
 ** (tshark:18229) 09:58:47.994375 [Main MESSAGE] -- File: "/var/tmp/wireshark_eno19kN1jG.pcapng"
   11 2.690111928 192.168.68.73 → 192.168.68.60 HTTP 881 POST /api/v2/write?org=Kodegeek&bucket=glances&precision=ns HTTP/1.1  (text/plain)
   24 3.824977400 192.168.68.73 → 192.168.68.60 HTTP 891 POST /api/v2/write?org=Kodegeek&bucket=glances&precision=ns HTTP/1.1  (text/plain)
   37 4.128239147 192.168.68.73 → 192.168.68.60 HTTP 901 POST /api/v2/write?org=Kodegeek&bucket=glances&precision=ns HTTP/1.1  (text/plain)
   51 5.872746588 192.168.68.73 → 192.168.68.60 HTTP 907 POST /api/v2/write?org=Kodegeek&bucket=glances&precision=ns HTTP/1.1  (text/plain)
   71 6.120250641 192.168.68.73 → 192.168.68.60 HTTP 868 POST /api/v2/write?org=Kodegeek&bucket=glances&precision=ns HTTP/1.1  (text/plain)
   91 6.503915790 192.168.68.73 → 192.168.68.60 HTTP 870 POST /api/v2/write?org=Kodegeek&bucket=glances&precision=ns HTTP/1.1  (text/plain)
  104 7.838737858 192.168.68.73 → 192.168.68.60 HTTP 883 POST /api/v2/write?org=Kodegeek&bucket=glances&precision=ns HTTP/1.1  (text/plain)
  117 8.576475158 192.168.68.73 → 192.168.68.60 HTTP 884 POST /api/v2/write?org=Kodegeek&bucket=glances&precision=ns HTTP/1.1  (text/plain)
At ‘glance’ not much is happening (pun intended) but if we go to the InfluxDB data explorer we will see a new bucket there, along with few collections:
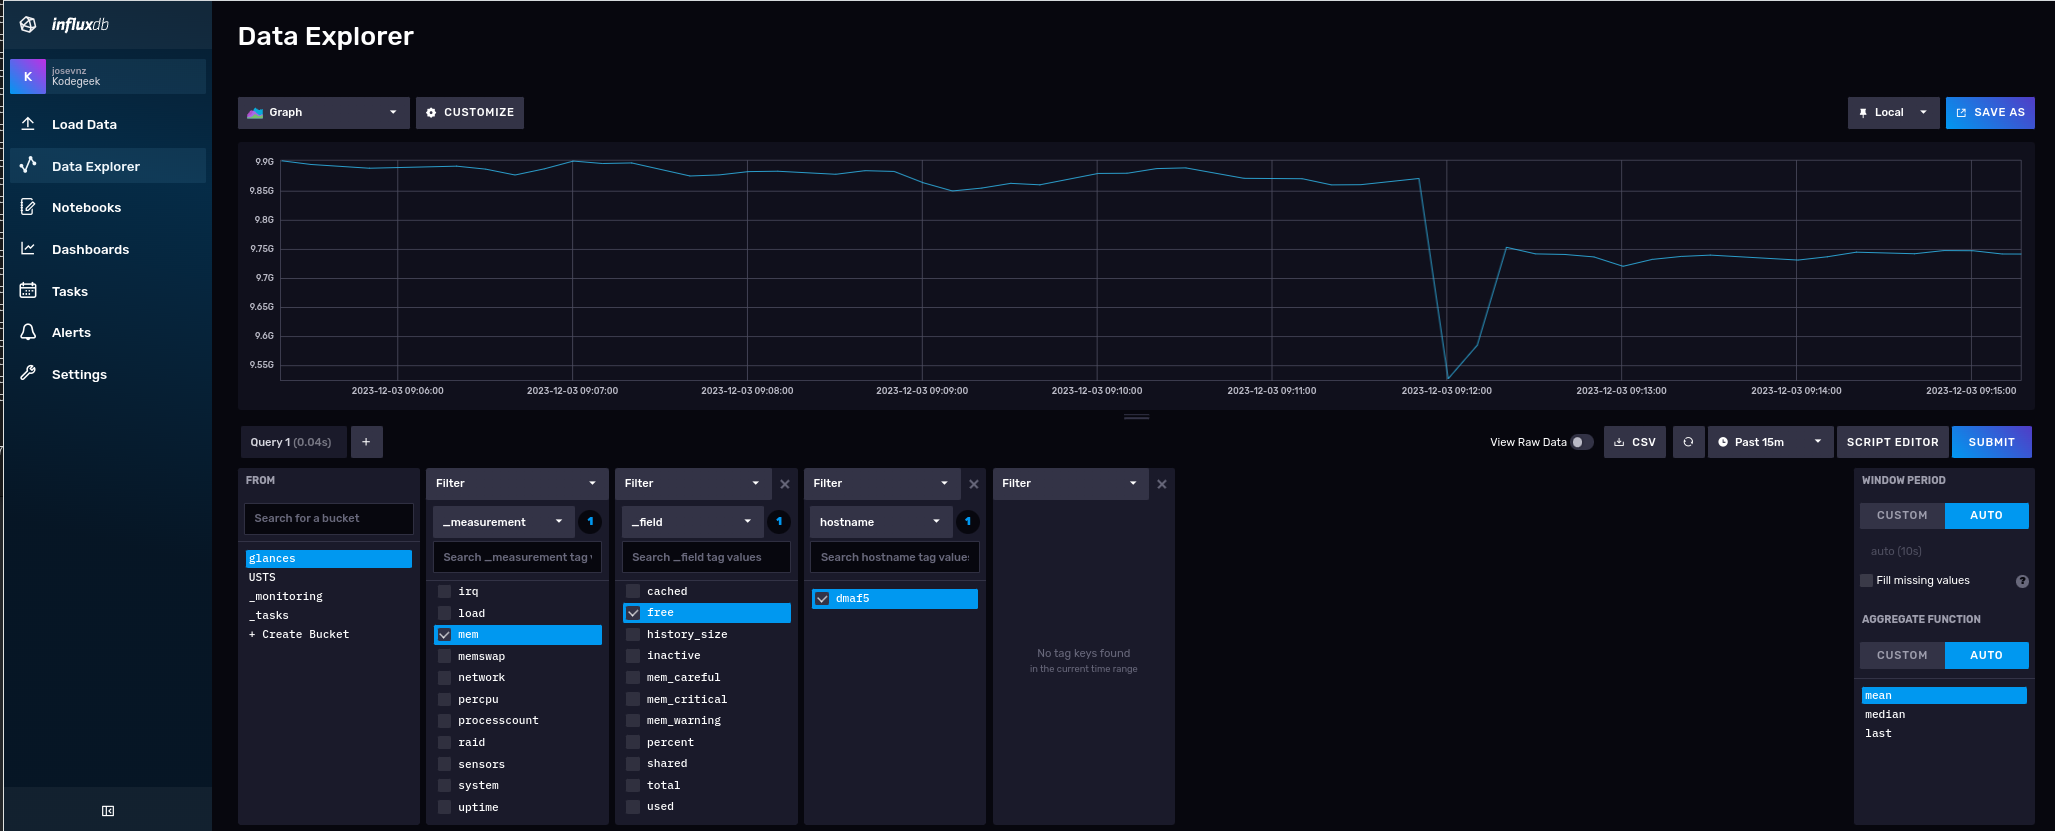
This particular time series shows memory utilization over time, where Glances is running. Glances by default collects many interesting metrics out of the box.
What did we learn
- If you are still curious about the Prometheus and InfluxDB overlapping functionalities, you should read this comparison.
- I showed you how to use tshark for troubleshooting. This tool is a must in your back of tricks.
- There are RPM available for Fedora to install node-exporter, Prometheus, Telegram. Feel free to try them, I wanted extra flexibility for my installation, so I decided to perform most of the installation steps manually.
- Glances and Prometheus are not the only possible integrations with InfluxDB. Many more are supported thanks to the Telegraf plugins.
- Source code for the Glances and InfluxDB integration can be downloaded from here, with examples.